Climate scientists are “a collective Noah,” Weaver says. They have done their job, given the evidence to the politicians — only to be ignored. Weaver, the author of Keeping Cool: Canada in a Warming World, also had a key role when the Nobel Prize-winning Intergovernmental Panel on Climate Change issued its report in 2007. People like him must be tempted to throw their hands in the air and walk away, particularly when constantly challenged by the half-informed.
It looks like he is doing an excellent job keeping Canada cool.
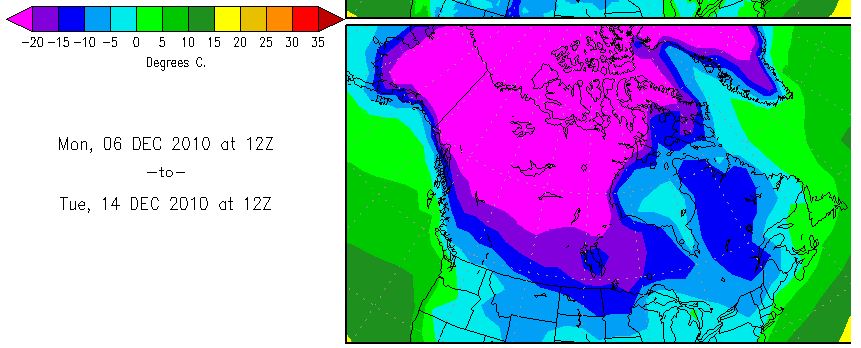
http://wxmaps.org/pix/temp2.html
h/t to Tom Nelson


Steven,
Did you see this one?
http://i.dailymail.co.uk/i/pix/2010/11/27/article-1333655-0C41F42B000005DC-198_634x418.jpg
From this article today:
‘Stay indoors!’ Police warn Britons to stay off the roads as temperatures fall to MINUS 10C and 15 inches of snow falls
http://www.dailymail.co.uk/news/article-1333655/Police-warn-Britons-stay-roads-temperatures-fall-10C-15-inches-snow.html#ixzz0gBUuBgA5
h/t tarpon
‘timescolonist’ — is a subsidiary of the onion, right?
Typical that all these left-wing eco-whackos have written a book!
Well I have theory. Weaver is thin at one end, thicker in the middle and thin at the other end!
LOL! Steven, check out the NCEP forecast map you have in this post. Notice Greenland at -20C and yet the “anomaly” is still +10C HOT. Just priceless.
Yeah using anomalies would be much more of an honest way of doing this. Absolute temperatures may make it “appear” cold to those of us not in these areas but the people living there could in fact think it is much warmer/cooler than average.
Temperatures next week are forecast to be far below normal across much of Canada.
Does that make it easier? NCEP doesn’t show anomalies for the following week.
I wonder where NCEP gets their data to determine the “anomaly”? Could it be possible that they get their anomaly sign wrong?
http://www.climatetemp.info/graph/nuuk_files/image001.gif
It looks to me -20C is 10 degrees COLDER than the historical data.
The anomaly map is for week one, and the temperature map is for week 2
Exactly, from Steve’s temp map it looks like Hudson bay is going to be about 0C, so that is pretty warm for this time of year. It won’t be filling up with ice that fast I guess then,
Talking of which, it still isn’t in the Chukchi sea much either, and it’s almost December.
Andy
Reasoning on anomalies alone is a way to stick the wrong kind of statistical analysis in the debate (you know, as in, if you have two meals and I have none, the average is one and enough for everybody. But I still starve).
If averages go up by +10C in a place where the average is -20C, and go down -2C where I live, how exactly will I be feeling that +5C of anomaly?
Yes, the alamists should throw up their hands and walk away. From idiots like us, who have the utter nerve to provide data from the real world that does not support their hysteria!