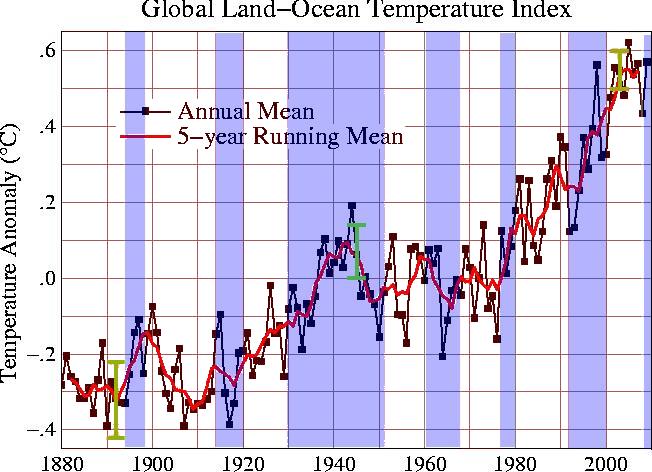
Democratic presidencies are marked in blue. Carter started the period of modern global warming in 1976, and the hottest year ever (2010) was caused by Obama’s hot air.
Grover Cleveland started the warming of 1893. Franklin Roosevelt also was a big warmer. Clinton was the biggest warmer of all.
By contrast, neither Bush caused any warming. Reagan started things cooling, until the Democrats took control of Congress.
Conclusion : expect fourteen years of cooling as Republicans control Washington.


While my theory needs some tweaking, you are providing even MORE evidence that those that believe cause warming and those that don’t cause cooling. What’s up with Kennedy and Johnson though. they must have read all those science articles about cooling. YES that MUST be it!
If you can help me get Inhofe elected in 2012 I bet we could have an ice age before the midterms in 2014!!! That would show those alarmist b**tards ( I am not sure. Are we allowed to swear here?)
Sounds like they need another love feast like Copenhagen to discuss methods? http://www.whiotv.com/nationalnews/25772071/detail.html
Would it be OK if we used temperature data up to 1980 and then spliced and filled in the rest of the data with tree proxies using one tree in Russia that shows significant cooling from 1980 to 2010? We would have proof of cooling that way and Penn State University would sanction our methodology.
Interesting theory Steve but it does lack evidence. It doesn’t really explain the warming of the 20s, the cooling of the 40s and 60s, the warming of the 80s and most of the present warming since 2000. Other than that – good job!
But it hasn’t been warming since 2000.
Your graph must be wrong then, that is what my comment was based on. Please correct it.
Yes, I believe the GISS graph is wrong since 2000, I am not in a position to correct it.
So you are knowingly using graphs you believe are wrong to make points that they don’t always support?
You are getting desperate.
That’s what I thought when I posted what I did.
Are you now denying that you have used a graph you believe is false to make your point? It does show warming since 2000.
You guys are losing it …
I’m not sure what Guys you are associating me with but it is you that has lost it if you are using data you think is in error to make your case.
You are getting lamer and lamer, along with the rest of the alarmist crowd.
I’m not alarmist, I just accept the science.
At least you are not denying the use of data you think is wrong to make a point you claim to be right – that is lame.
does this mena my mental theory is wrong.
lazarus, you made me laugh again. You sounded JUST like Steve. hounding him about using an incorrect graph about a totally frivolous issue! and even though this is a total fantasy he concocted he STILL can’t admit it.
At least I am willing to sadly give up on my theory, now that you have shown me it is factually innacurate.
Kudos