http://www.ncdc.noaa.gov/oa/climate/globalextremes.html
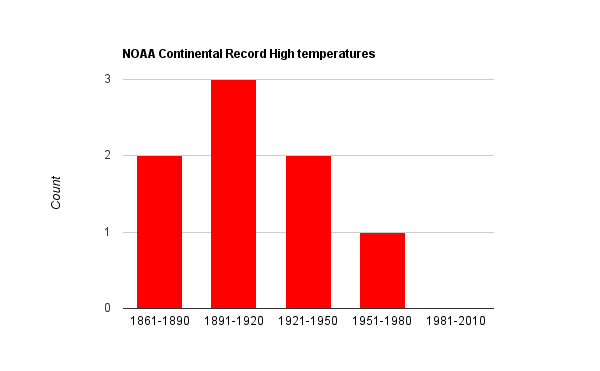
No continent has set a record high temperature since the 1970s. The 30 year period with the most record high continental temperatures was 1891-1920.
(For the intellectually challenged, a record continental temperature mans that no location on any day of any year has ever been hotter. That includes hundreds of thousands or millions of records.)
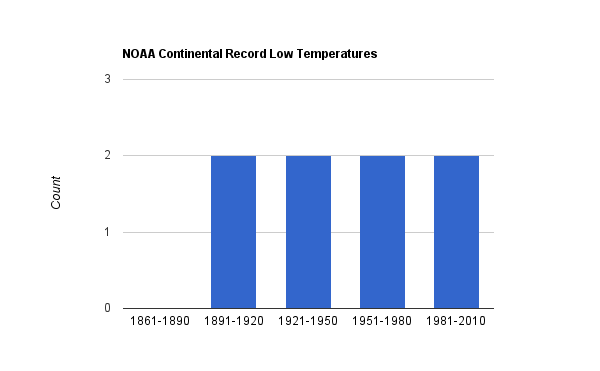
Record low temperatures have been more evenly distributed. Every 30 year period since 1891 has had two.
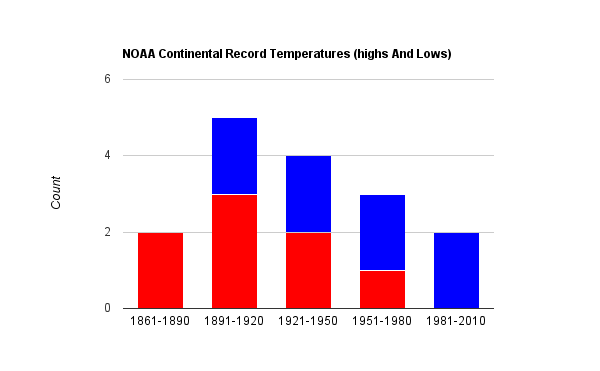
Total record continental temperatures (highs + lows) again show that 1891-1920 was the most extreme. It has been 16 years since any continent set a record temperature in either direction.
All but one of these “extreme” record temperatures were set when CO2 was below Hansen’s safe level of 350 ppm.
So next time some whiner starts complaining about extreme weather due to CO2, tell him to …. well you know.


But you are only showing 16 data points! Would it not be better to confuse the issue with 550 million data points so no one would be able to figure out what you are talking about? 😉
The first figure was 16 before a finger slip. 🙂
ChrisD:
It is a joke and I am only trying to explain it to those that are mentally challenged. It looks like I failed.
There are those that do not understand the total number of records that are needed to arrive at the “Simple” results and that simple results have more meaning than convoluted garbage.
Mike, you can make a joke of it if you like, but the fact that there is almost no data is relevant. We’re talking about eight total data points per chart. That is just not much information.
It’s like trying to show that the average human isn’t getting fatter because Europe’s fattest person ever lived in the 1930s. (Yes, it’s not a perfect analogy because people live longer than one day, but it’s the best I can come up with after a long, long day.)
You mean all of the land area on the planet doesn’t count? What a maroon.
God, you don’t even know how to spell “moron.”
And, no, that is pretty obviously not what I meant.
I have to figure out this reply link thingy as my reply to Chris is above.
Chris, really?
Chris, in this particular case, I don’t mean to be an antagonist, but rather a lender of friendly advice.
Consider you are the most antagonistic voice here. There are others, but you are more prolific. Now consider the volume of traffic this site has. It is fairly significant. Some of your points are pertinent and very worthy of discussion.
But, you loose credibility when you argue points you can’t win. Look, show where Steven is wrong, or accept his posit and come up with an alternative view. The “no counts” view has been over done by most 10 y/o ‘s .
As you probably know by now, I’m a skeptic. But, I’m all for open and lively debate. Not to put any pressure on, but people are watching and reading. You’ve got “but the fact that there is almost no data is relevant.” Stop that. It absolutely is relevant and everyone reading knows it is. Earlier we were told 40,055 records have been set since “global warming” started. Steve has put it into context as to the relevancy to the general public of the continents. And rightly so. This is a global concern, is it not?
What a maroon……..God, you don’t even know how to spell “moron.”
Settle down ChrisD, settle down. Didn’t you ever watch Bugs Bunny?
http://www.youtube.com/watch?v=C_Kh7nLplWo
suyts says:
November 2, 2010 at 3:50 am
But, you loose credibility when you argue points you can’t win.
It could be that he just doesn’t know what he’s doing.
Look, show where Steven is wrong, or accept his posit and come up with an alternative view
Already did that in part 1.
And another commenter, apparently unaware of mine, said virtually the same thing.
Amino says:
Settle down ChrisD, settle down. Didn’t you ever watch Bugs Bunny?
Apparently you missed this, in which I said “What a maroon” and received this brilliant response:
And when someone courteously pointed out the Bugs reference, Steve’s sarcastic response: “Right”.
Amino says:
It could be that he just doesn’t know what he’s doing
Sorry, but a person who thinks we can learn anything useful by distilling millions of data points into eight is the one who doesn’t know what he’s doing.
Chris,
You are spamming again. And you have no idea what you are talking about. You have just about worn out your welcome.
Let me try this again, since you censored it the first time:
Responding directly to the topic of a comment made to me is not spam unless you think that the original comment was also spam.
The problem Chris is that you *always* avoid the central topic of the discussion. And you post the same crap over and over again.
The problem Chris is that you *always* avoid the central topic of the discussion.
Repeating this over and over don’t make it true. My first post on this topic, for example, was directly on point. The rest are responses to comments, and are directly on the points of the comments. This is not spam, no matter how thinly you slice it.
Chris, your density level is hitting rock bottom. An all time continental temperature record means the hottest temperature out of hundreds of stations over hundreds of years.
For North America that works out to :
1000 * 365 * 120 = 7,800,000 records.
The hottest temperature every recorded out of almost eight million records.
Get a clue. You are making a fool out of yourself.
Already made! just adding conformations. It is true: when you find your self in a hole, Stop Digging! Climatology believers do not understand that concept.
stevengoddard says:
November 2, 2010 at 3:09 am
Chris, your density level is hitting rock bottom
I wouldn’t be sure of that.
But it tells you nothing about the trend for the continent.
But.. but.. Brendon said if there were more cold records than hot he would swear off AGW koolaid… right on this blog…
Steve, I don’t know where you got your degree(s), but you should sue them for malpractice.
You are allowing a single event to obscure decades of trends for an entire continent. You are condensing eight million data points into one.
This is the dumbest way of assessing a trend I have ever seen.
But.. but.. Brendon said if there were more cold records than hot he would swear off AGW koolaid… right on this blog…
There aren’t. That’s the whole point. Take Steve’s previous whiner post, which covered just the US. If you look at all the record temps instead of just one per state, there were twice as many record highs as record lows during the 2000s. That is a far, far more interesting statistic than this silly stuff he’s posting.
Was anything occuring in the 20’s and 30’s to cause such events? I believe many Australian records are set in that era, and you recently posted on the 30’s flood in China.
Smiffy:
Yes there was a global situation happening in the 20s and 30s. The situation was long term regional ocean and atmosphere weather patterns happening and they are still happening today. Sometime they compliment each other to strengthen the results. Sometimes the have a neutral effect on each other which leads to sort of average weather. Some times the are in conflict and strengthen negative results like more extreme weather events. these weather patterns are measured in multi decades with an average of 6 decades but can range from 4 to 8. Because they are regional and do not have the same periodicity it could be thousands of years until a repeat of certain weather conditions occur again. There are some longer cycles evident in the global patterns also that contribute to the overall weather conditions we experience.
AAM:
I can do the short stuff.
“Ignoranamus” I forgot that Waskelly Wabbit!
TH-TH-TH-That’s all folks
Weathermen focus on daily records in specific locations. (what’s the point of highlighting Cloncurry, Queensland as a record holder of Australia when it’s not representative of the continent).
The climate is about the global long term trend.
http://woodfortrees.org/plot/hadcrut3vgl/from:1850/plot/hadcrut3vgl/from:1850/trend
Brendon:
It is indeed about long term trends. However there is sufficient evidence that the records you linked to have been corrupted or no longer display reality due to excessive errors in the records that have not been accounted for.
Secondly; Long term trend must account for all known long term weather patterns and have sufficient representation of the interaction among the regional weather patterns to be globally significant.
150 years is not as regional weather patterns are about 60 years average so just for a regional climate picture you would need 5 to 10 weather cycles or 300 to 600 years. Consider a factor of 10 fr a global picture on top of the needed time for regional climate patterns.
Your use of 150 years shows your limited capacity of comprehension of real climate. It appears you have been drink from the “Facts” at Surrealclimate web site or listening to the EX-perts from the governmental organization IPCC.
Your use of 150 years shows your limited capacity of comprehension of real climate.
Then I guess I have to ask why you are defending this blog post, which also uses 150 years.
Sauce for the goose, etc.
Pingback: Unusual weather event - Page 3 - TheEnvironmentSite.org | The World's Largest Independent Environment Forum