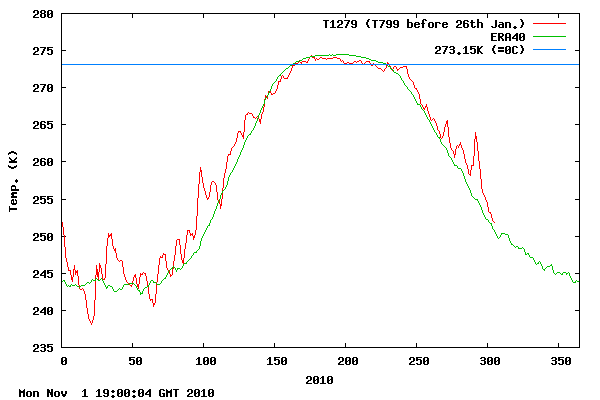
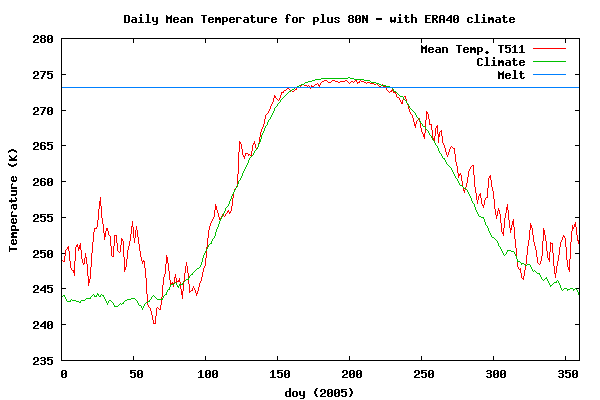
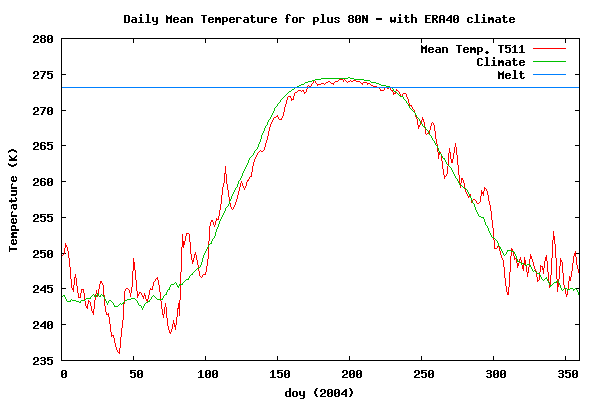
http://ocean.dmi.dk/arctic/meant80n.uk.php
Hansen justifies his Lone Ranger “hottest year ever” claim with explanations that he does better at measuring the Arctic. This in spite of the fact that he has no actual temperature measurements north of 80N.
How interesting that DMI shows June-October temperatures north of 80N as coolest since at least 2005, and possibly since 2004.


Lone Ranger “hottest year ever”
Nice.
Can I ask how far in Kms or miles is 80N to 90N?
I’m too useless to find out for myself – 690 miles?
That’s a good guess! It’s what I got in google earth.
It’s interesting to note that if it is the coolest 4-month period in the last five years (the two graphs are pretty, but can you post values for the five years?), that sea ice extent is at record lows for AMSRE (http://www.ijis.iarc.uaf.edu/seaice/extent/AMSRE_Sea_Ice_Extent_L.png), NSDIC (http://nsidc.org/data/seaice_index/images/daily_images/N_timeseries.png) and close to second in DMI (http://ocean.dmi.dk/arctic/icecover.uk.php).
Must be lots of other variables at play up there than just temperature.
Gee. Colder than in the enitire history – so long as you don’t go prior to 2005!!!
Cheery picking again!!
That is what the title of the article says. I’m assuming that the readers can read.
I do believe that you missed a “minor point”.
Big Jim does not have “ANY” temperature monitoring stations above 80 north to measure the temperature when DMI does.
If Steve uses the figures from DMI as a basis for his comments and has advised you that is where the information comes from what part of the meaning of “IT” do you not understand?
Brendon:
Did you miss the point that DMI made the claim of coldest since 2005 or possibly 2004. While Big Jim claims it is warmest ever on record!!!!
I can’t find any press release from DMI and Steve didn’t provide a link (Can I assume these are your own calculations then Steve?), so the claims are kind of nebulous.
Do both ‘claims’ cover the same area? It sounds like “Big Jim” (Hansen?) might be talking about the year so far, while Steve is singling out a 5 month period.
If that’s true, it’s really apples and oranges… so many unanswered questions.
Look at the DMI link in the article. You can compare the graphs for every year they have records for.
BBTXU: see my reply to you above . It got linked to the wrong post.
Compare? As in visually? Can you tell us your rankings for the 5 years?
Or was it done numerically? Do you have values?
It would be nice if DMI published them. Since they don’t we have to rely on the graphs.
Wow. While googling for DMI’s T799 dataset, came across this post: http://www.skepticalscience.com/DMI-cooling-Arctic-advanced.htm
Your readers might enjoy wading through that. Gonna have to take a day or two to digest all that…
BBTTXU:
At 40 below I do not think air temperature is contributing to ice melt. It appears we are see a restriction in ice accumulation due to wind direction and speed. In other words the wind is blowing the ice around or compacting it.
Well, quite the opposite, not much melt going on right now 😛
If it is indeed windier now then before, I’ve always found that wind helps increase ice growth, plus the cooler temperatures, It’s just surprising that we don’t have a record high ice extent (at least for the past five years) given the conditions.
I also wonder wonder why wind would cause compaction. Every picture I’ve seen of the North Pole is awful flat, doesn’t seem like there is a lot of protrusions for the wind to “push” against to cause that compaction (wind pushes a sailboat much more than a low-profile kayak, for example).
bbttxu:
I guess you missed the pictures from the Catlin Expidition and those from the live cast at the Buoys on the ice. I guess you alklso missed the report from NSIDC regarding the ice loss in 2005 being caused by wind blowing the ice out of the Arctic and compacting it. You can add the ocean current patterns that are driven by the “WIND”. The AO is:
The Arctic oscillation (AO) is an index of the dominant pattern of non-seasonal sea-level pressure variations north of 20N latitude, and it is characterized by pressure anomalies of one sign in the Arctic with the opposite anomalies centered about 37-45N.[1] This zonally symmetric seesaw between sea level pressures in polar and temperate latitudes was first identified by Lorenz [2] and named in 1998 by David W.J. Thompson and John Michael Wallace. [3]
The North Atlantic oscillation (NAO) is a close relative of the AO and there exist arguments about whether one or the other is more fundamentally representative of the atmosphere’s dynamics; Ambaum et al. argue that the NAO can be identified in a more physically meaningful way.[4]
Over most of the past century, the Arctic Oscillation alternated between its positive and negative phases. Starting in the 1970s the oscillation has tended to stay in the positive phase, causing lower than normal arctic air pressure and higher than normal temperatures in much of the United States and northern Eurasia.[5]
I found this at WIKI just because you seem to be a WIKI type of person.
Translation:
The Arctic Oscillation is a long term ocean atmosphere weather pattern characterized by changes in wind patterns and currents due to changes in surface pressure regions.
Then there is the minor issue that ice extent is measured as 15% or greater in a pixel is considered as 100% for the records and the pixels with a greater extent of 15% are counted to determine the total ice extent. In reality the true ice extent could be up to 85% less than the reported amount. Talking about Ice extent and records: There have been a number of satellites that have been used to take the pictures that are used for the revaluations since 1979 when it started. I know there has been a “SLIGHT” 10000% or better improvement in resolution. The Al Gore rythum to determine the results has changed over time and the “Mask” used for isolating land areas has also been refined with the much improved resolutions.
Do you want to discuss comparing “Apples and Oranges”? the results and comparisons from NSIDC adn other agencies that monitor and report the ice records are fruit salad due to the many differences used. I “Know” that they have the “Proper” Al Gore Rythum to correct /adjust / homogenize the records to be meaningful to the true believers!
Nothing melts ice as fast as wind. You obviously don’t live near a frozen body of water.
Mike, thanks for the lengthy reply. Is this the 2005 NSIDC report you talk about (http://nsidc.org/news/press/20050928_trends_fig2_3.html)?
The closest match to ‘compacting’ (or ‘compaction’) is ‘compact’ (“However, the ice cover has been much more compact during the minimums of 2004 and 2005″). It doesn’t seem to describe a process, rather state simply that the size of the ice pack is smaller. Neither does ‘wind’ appear in that news release. Puzzling.
Furthermore, when I restrict a google search to the NSIDC site alone (http://www.google.com/search?q=site:nsidc.org+sea+compaction), the results talk specifically about Antartica and/or Greenland continental sheets, but none (of the top 10) talk about compaction as a process that occurs in arctic sea ice. :\
Off to bed, but can you help me out with any links I might have missed? Wanna read more tomorrow…
Very thick ice according to PIPS and Steve and very cool weather, so it’s quite amazing so much ice disappeared.
Even on the rebound the amount of ice is almost lower than 2007 on JAXA.
By the way, why does that graph smooth out in the summer and become very jagged over the winter?
Andy
The area of sea ice has doubled over the last six weeks. What are you talking about?
You say that like it has some sort of significance.
It always grows rapidly this time of year.
Currently it’s near a record low.
http://www.ijis.iarc.uaf.edu/seaice/extent/AMSRE_Sea_Ice_Extent_L.png
So if we are back to 2004 levels, that means the arctic is cooler than 1938 even on GISS own figures.