Disrupting the Borg is expensive and time consuming!
Google Search
-
Recent Posts
- Gaslighting 1924
- “Why Do You Resist?”
- Climate Attribution Model
- Fact Checking NASA
- Fact Checking Grok
- Fact Checking The New York Times
- New Visitech Features
- Ice-Free Arctic By 2014
- Debt-Free US Treasury Forecast
- Analyzing Big City Crime (Part 2)
- Analyzing Big City Crime
- UK Migration Caused By Global Warming
- Climate Attribution In Greece
- “Brown: ’50 days to save world'”
- The Catastrophic Influence of Bovine Methane Emissions on Extraterrestrial Climate Patterns
- Posting On X
- Seventeen Years Of Fun
- The Importance Of Good Tools
- Temperature Shifts At Blue Hill, MA
- CO2²
- Time Of Observation Bias
- Climate Scamming For Profit
- Climate Scamming For Profit
- Back To The Future
- “records going back to 1961”
Recent Comments
- Bob G on Gaslighting 1924
- Bob G on Gaslighting 1924
- conrad ziefle on Gaslighting 1924
- Bob G on Gaslighting 1924
- Bob G on Gaslighting 1924
- arn on Gaslighting 1924
- conrad ziefle on Gaslighting 1924
- Gordon Vigurs on Gaslighting 1924
- conrad ziefle on Gaslighting 1924
- Robertvd on Gaslighting 1924
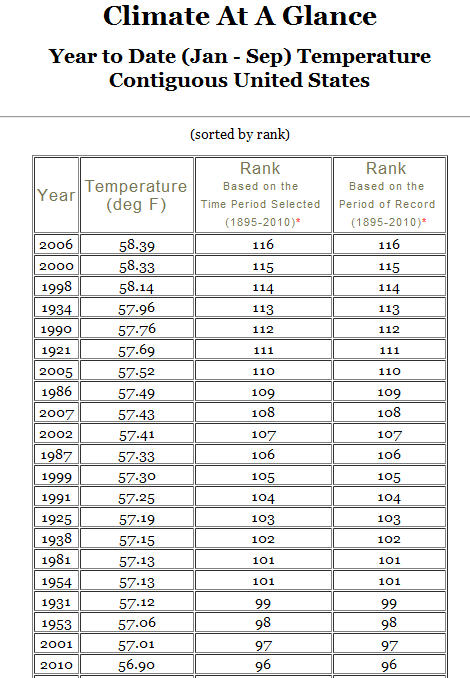
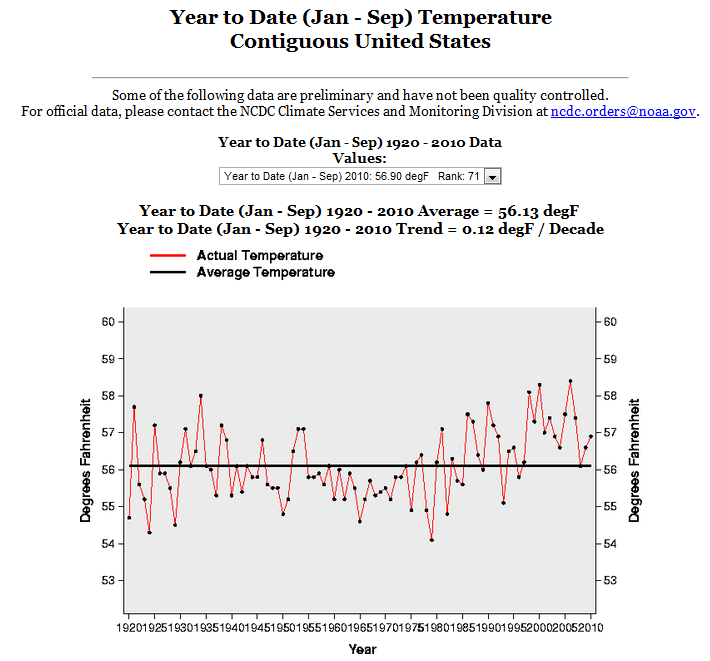
Hottest Year Ever : US January-September Cooler Than 1934, 1921, 1925, 1938, 1954, 1931, 1953 (And 14 Other Years)
This entry was posted in Uncategorized. Bookmark the permalink.


Hey, don’t start looking up data. Data is not relevant in what is happening now in global warming.
;o)
what I just said is suitable for the tweeting bot
Steven:
Unless it changed recently the meteorological year is Dec through Nov as the use the meteorological seasons starting with winter.
I agree with your conclusions in principle but wanted to bring that up.
The other thing is the surface temperature record is FUBAR to use a mild description.
Land surface temperatures can be off by more than 5C either way, but primarily a warm bias. The sea surface temperature is a joke at best and should be discarded.
Anecdotal evidence shows a possibility that the 30s were warmer globally. Other than that there is not enough precision to make any other claims.
NCDC considers the year to be January-December
I have seen it both ways and it gets convoluted trying to keep track of the players and the rules of the game which are always changing. It is sort of like turning on a baseball game and by the third inning you are watching Hockey. Then before the game is over you are watching soccer or a marathon.
And so many in the last decade.
Oh hang on, US only? Not even global?
Defeated by the cherries again!
Brendan, ive had plenty of beers watching England touch up Western Australia in a tour match. Stop posting you’re pathetic socialist piss weak drivel or ill fire up. You are a complete twat.
Well if there is no warming in the US there must some somewhere else.
Maybe New Zealand?
http://briefingroom.typepad.com/the_briefing_room/2009/11/breaking-nzs-niwa-accused-of-cru-style-temperature-faking.html
Or Australia?
http://www.americanthinker.com/mws-ghcn-averages.jpg
Or Canada?
http://www.vancouversun.com/technology/Scientists+using+selective+temperature+data+skeptics/2468634/story.html
Or Russia?
http://blogs.telegraph.co.uk/news/jamesdelingpole/100020126/climategate-goes-serial-now-the-russians-confirm-that-uk-climate-scientists-manipulated-data-to-exaggerate-global-warming/
Or China?
http://www.guardian.co.uk/environment/2010/feb/09/weather-stations-china
Or Bolivia?
http://www.appinsys.com/globalwarming/RS_Bolivia.htm
http://chiefio.wordpress.com/2010/01/08/ghcn-gistemp-interactions-the-bolivia-effect/
I believe that Paul H has easily put your lame attack post down for the count.
What percentage of the total worldwide stations are in the US again?
Another stupid post from Bendon.
You are so dumb,that you fail to see that Steve was commenting about USA,in several ways in his post.
I hope you realize that America has by far the most extensive station coverage in the world.Plus we have NINETY years of data as charted and drawn from the NOAA database.
common steve, you can’t just plot actual data.
first you have to add value,
then adjust it,
then homogenise it.
your nifty algorithm to do all this then gives you…
“Warmest Year EVAH!”
everytime!
Peterhodges:
Spell checking time.
The correct spelling is Al-Gore-Rhythm.
And this is the U.S. I believe the latest data shows worldwide temperatures for January through September were either the hottest on record or matched the hottest on record.
That depends on your source for the information! It also depends on their ability to adjust historic records to provide desired results.