http://littlegreenfootballs.com/
The disaster loving crowd is in hysterics about my June sea ice forecast of 5.5 million km^2, which was 11% too high. What they wanted to see was this :
Sadly for them, they didn’t get their record low. The graph below shows how my forecast error (green) compared to the PIOMAS forecast error (blue.)

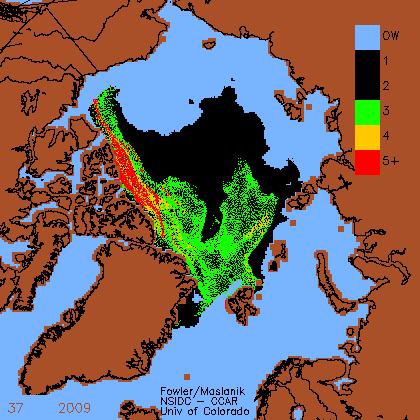
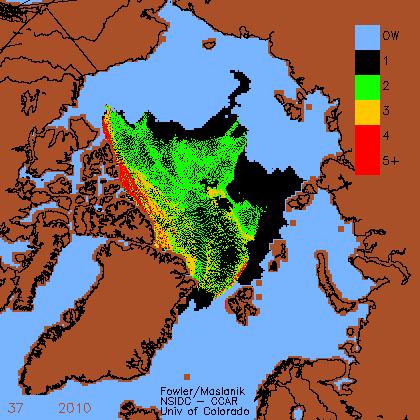
But the big story is that there is likely to be a significant increase in 2011 multi-year ice relative to spring 2010. The maps below show why :

2009

2010
There is more multi-year ice this year and it is located further from the Fram Strait. Also, Arctic temperatures are much lower this autumn. Disaster lovers are probably going to be very disappointed next year.


We should plan a birthday party for when the first year ice becomes multi-year ice.
The big difference seems to be in the colour coding between 2009 and 2010… beyond that it is difficult for me to identify the changes…
The color coding is mine. I advanced the age by one year at the end of September, because NSIDC put out their map one week too early. The MYI colors (green yellow red) are identical in the two maps.
By putting out the graph early there is not as much MYI. They should show MYI at the end of the growth season because that is when the ICE BIRTHING season ends.
Now I am totally confused… in 2009 both year 1 and 2 are black… in 2010 both year 4 and 5 are red… so I can only compare year 3 on both maps.
Year 3 has shrunk in 2010 (yellow) compared to 2009 (green).
Years 4 + 5 has shrunk in 2010 (red) compared to 2009 (yellow + red).
Guess I am missing something…
The 2009 map shows one year old ice and one week old ice as black.
There is less five year old ice now than this date last year, but more four year old ice.
Wind speed and direction are the primary drivers and also the wild card concerning ice extent at any given time of the year. NSIDC is a waste of taxpayers money that should be eliminated along with the rest of the group in Colorado and many other universities in the US. People like Lindzen, Christy, Spencer, Maue, Landsea can provide all the expertise we require because they are interested in researching causes instead of promoting the Anthropogenic Cause Du Jour.
Steve, did you see this report of Joe’s. Sorry if already posted, but I enjoyed it!
http://www.accuweather.com/video.asp?channel=vbbastaj
“Is Norway a right wing think tank”
“They must be having a tea party over there, an ice tea party”
Have fun
Don’t feed the trolls. Charles Johnson and his merry band of sycophants are untroubled by things like actual measurements and confirmed observations. Better to enable LGF to maintain the obscurity they so richly deserve.
You know, it used to be a nice blog a few years ago… then people started getting crazy. I kind of feel bad for LGF and Charles. It’s sad really. I think a mental illness may be responsible.
I was recently tossed off LGF. A gent named LVQ is a promoter of the worst possible CAGW. I had challenged him and Charles numerous times. Charles didnot know what lapse rate was when talking about mountain glaciers and whether they were retreating due to GW. They now talk to themselves.
Sorry folks, wrong link, should be this one:
http://www.accuweather.com/video/676187659001/monday-morning-sea-ice-report.asp?channel=vbbastaj
I will get me coat…
steven
anthony watts has good summary… looks like you had a revision of 5.1mk that put you right in there
The focus on the September minimum extent is ridiculous anyway. I’m more interested to see what happens to the MYI over the winter.
my question on the myi is just how old is the myi supposed to get anyway?
seems it gets flushed (or melts- hah!) regularly or we would have some serious multi year ice piling up.
I don’t know the Geography in that part of the world so well, but a previous animation I think I saw here showed that sliver of MYI in 2009 rotating clockwise, then being pushed away from the Chukchi Sea. Ultimately, it rotated around and was sucked south thru the Fram Strait. Leaves you wondering. If man were able to block the Fram Strait, could we instigate a much larger NH ice cap? Probably.
In my travels, saw this ultra cool pic of Greenland: http://www.sagaxexpeditions.com/Images-site/Sagax%20Greenland%202007/The%20Greenland/The%20Greenland1.jpg
On google, select images and Greenland. The photos are fantastic.
“The focus on the September minimum extent is ridiculous anyway. I’m more interested to see what happens to the MYI over the winter.”
The current “colder than typical” temperature in the arctic basin indicated by the DMI data have made the Arctic Basin area, as plotted on Cryosphere Today, to be well above normal and about 6 to 8 weeks ahead of 2009. The first year ice in the basin will now have more time to age (thicken) before the spring and the probability that the multiyear ice will thicken and hang around for another year is going up.
The cold temperatures currently over the Barrents and Kara Seas should increase their rate of growth over the next week. The Hudson is also finally covered with a region of cold (-5 to -20 C) air that should fast track the ice growth there.
Surreze….NSIDC….Sadly for them, they didn’t get their record low.
Ya, we’re sobbing over it.
;O)
Steve said
” Also, Arctic temperatures are much lower this autumn. Disaster lovers are probably going to be very disappointed next year.”
Where are they lower?
If it is so cold why is 2010 following 2006 at the moment?
http://www.ijis.iarc.uaf.edu/seaice/extent/AMSRE_Sea_Ice_Extent_L.png
still that pocket remains between Alaska and Siberia
http://www.iup.physik.uni-bremen.de:8084/amsr/arctic_AMSRE_nic.png
Andy