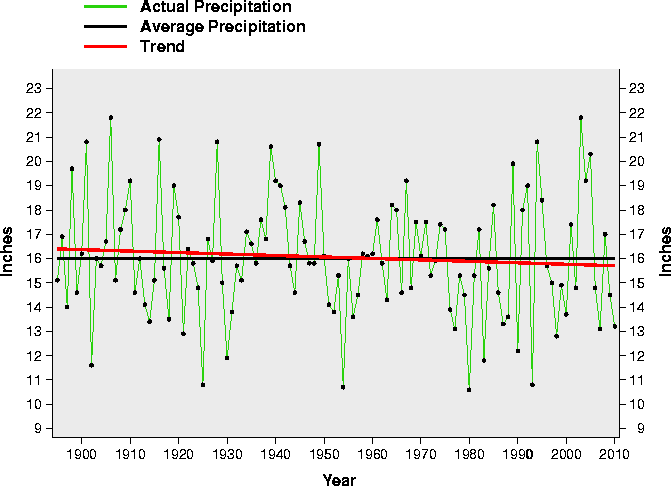
Duke did a study “Variable southeast summer rainfall linked to climate change” which cleverly concluded that the period from 1948-2007 saw increasing variability in rainfall and blamed it on climate change.
One look at the NCDC Southeast US summer precipitation graph above confirms that the variability of rainfall was greater from 1980 to 2007 than it was from 1948-1979. It was also greater prior to 1948.
What is also obvious is that the variability has nothing to do with CO2. How did they pick the date 1948 to start their study? The standard deviation from 1895-1947 (2.4) was nearly identical to the standard deviation since 1948 (2.5.)
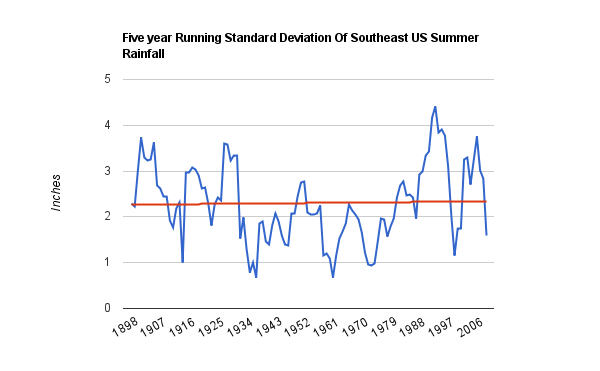
It looks like the 1948 date was cherry picked. There is no long term trend towards increased summer rainfall variability. The graph below plots the five year running standard deviation of southeast US rainfall, using the entire NCDC database.


John Wayne is doing climate studies? Who would have thought?
I thought you show the same results last time with one station.
When you take the entire South East into account you end up with multiple climate regions that are driven by various weather patterns.
I know! I know! It show the same thing, Basically, and it is all due to long term natural weather patterns.
You Cherry Picked by starting at 1898! WY if you had started with 6 thousand BC you probably would have come up with similar results, just more over all variability.
I forgot:
😉 😉
There are statistical methods available to compare “populations” of variables to determine whether they are significantly different or not. (Chi-squared etc.)
Just eyeballing is not usually enough to be certain but 2.4 vs 2.5 would seem to be pretty similar especially considering the range of values involved.
“Duke did a study “Variable southeast summer rainfall linked to climate change” which cleverly concluded that the period from 1948-2007 saw increasing variability in rainfall and blamed it on climate change.”
Not really. What they actually did was to analyze sixty years of U.S. and European weather and climate data. Not just look at rain fall in the Southeast of the US.
What they found was that the summertime North Atlantic Subtropical High intensified by 0.9 geopotential meters a decade on average from 1948 to 2007. “(Geopotential meters are used to measure how high above sea level a pressure system extends; the greater the height, the greater the intensity.)”
You have provided no evidence to dispute this.
They also found found that as the North Atlantic Subtropical High intensified, its area grew, bringing the high’s weather-making western ridge closer to the continental United States by 1.22 longitudinal degrees a decade.
Again you have provided no evidence to dispute this research.
As the article you linked to says;
‘This is not a natural variation like El Nino,” says lead author Wenhong Li, assistant professor of earth and ocean sciences at Duke University’s Nicholas School of the Environment. “We thoroughly investigated possible natural causes, including the Atlantic Multivariate Oscillation (AMO) and Pacific Decadal Oscillation (PDO), which may affect highs, but found no links.’
Just because you assert that precipitation was just as variable at another time is not evidence that what caused it then is what is causing it now. If you have the evidence I’m sure Wenhong Li would be interested to know what was over looked.