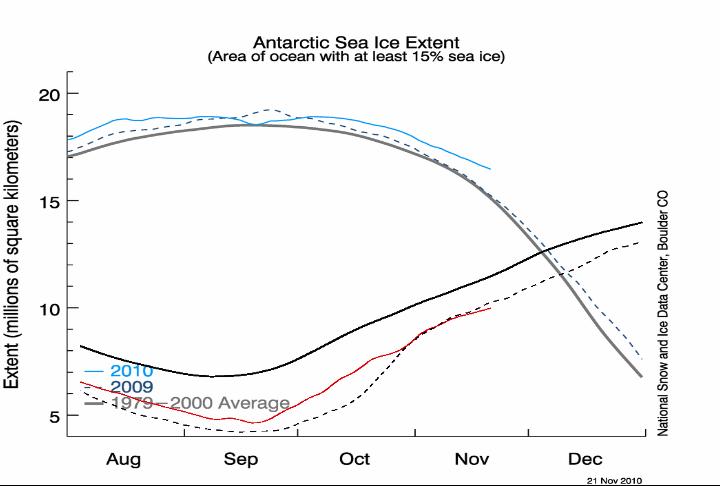
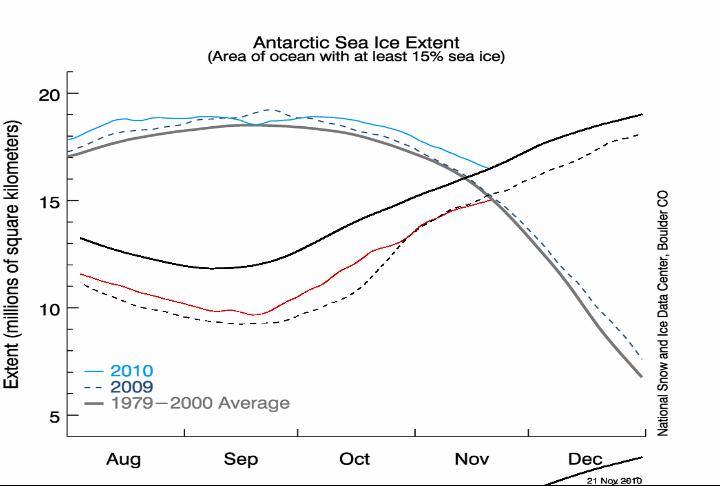
The graph above overlays the NSIDC Arctic graph (red) on their Antarctic graph (blue) with both axes normalised to the same scale. Note that there is almost twice as much sea ice in the southern hemisphere as there is in the northern hemisphere. The northern hemisphere is about 1.5 million km^2 below the mean, and the southern hemisphere is about 1.5 million km^2 above the mean.
The next graph shows the Y-axis shifted to line up the deviations. Note that they are equal and opposite.
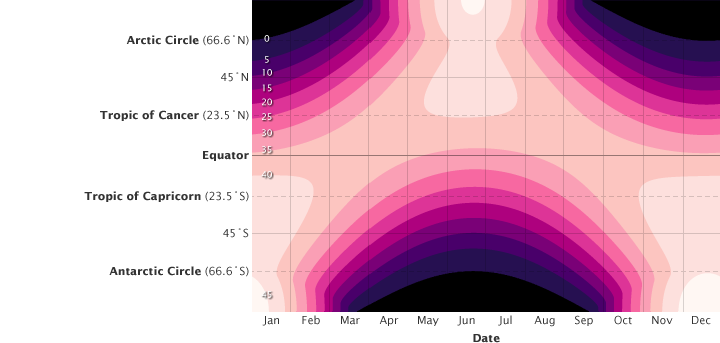
The Antarctic anomaly has a large effect on the Earth’s radiative balance for two reasons.
- Solar radiation is near its peak in Antarctica this time of year
- The excess ice is at low latitudes, meaning it gets hit by a lot of direct sunlight.
By contrast, the Arctic receives almost no solar radiation this time of year, so it has little impact on the Earth’s radiative balance.
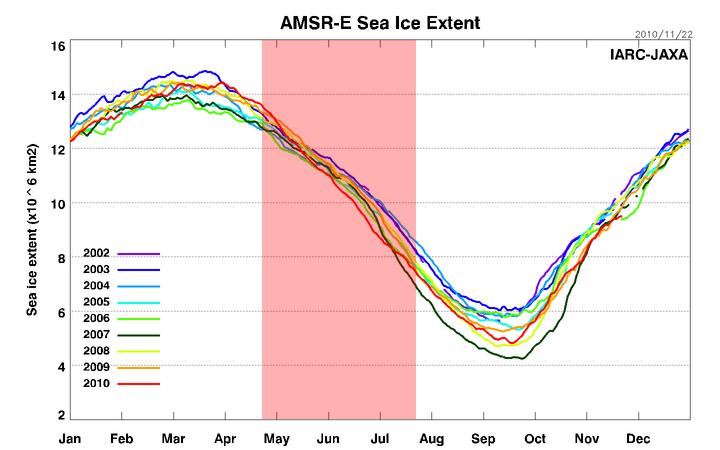
The northern hemisphere solar peak occurs between April 20 and July 20, when ice extent is always close to normal. At the time of the ice minimum in September, there is very little sunshine, so it has minimal effect on the radiative balance.
http://earthobservatory.nasa.gov/
Conclusion : the excess ice in the southern hemisphere has more impact on the Earth’s radiative balance than the ice deficiency in the northern hemisphere. I ran this idea by Walt Meier at NSIDC two years ago, and he did not disagree.
Peter Sinclair got this backwards in his video below, where he claims the exact opposite.
[youtube=http://www.youtube.com/watch?v=-wbzK4v7GsM]


Peter Sinclair is an Al Gore Clone at best! Cloud cover plays as large or larger part in controlling the amount of energy as the ice because cloud cover keeps solar radiation from dirty ice.
The use of WATTS UP borders on copyright infringement which he has already been guilty of.
If we are talking about radiative imbalance, don’t forget all the extra heat being lost from the Arctic ocean at this time of year if there is less ice!
Yes. Arctic is my next topic.
Steven – isn’t there a more general principle due to the geography?
Ignoring perihelion/aphelion effects (treating the orbit as circular) high latitudes at NP and SP have the same angle of incidence of sunlight, half an orbit apart. The NP comprises the sea ice over the arctic basin predominantly surrounded by land, at SP it is the Antarctic ice sheet on land with sea ice over the ocean.
I am probably being over-laborious but isn’t the difference that at NP summer the melt can give open water closer to the pole and possibly a more complete melt (at high latitudes) than at SP summer, where the melt is predominantly at latitudes lower than 75 deg S. At the pole the summer sun reaches almost 24 degrees altitude, whereas at 75 deg or less it is approx 40 alt, giving 58% / m^2 more solar radiation at the surface.
If this is right then doesn’t it mean that the albedo feedback effect at NP is inherently less than its effect at SP…?
Well Two Medicine in Montana is pretty cold at -62 degrees C! :o)
http://www.nps.gov/webcams-glac/tmcam.jpg?3446861&0.22587048110884072
Steve, I think this is getting quite close to a record low?
It looks like a bad sensor to me. Other temperatures in the park are much warmer.
Global sea ice area
http://arctic.atmos.uiuc.edu/cryosphere/IMAGES/global.daily.ice.area.withtrend.jpg
SteveS:
Fruit Salad!!!!!!?
Sea Ice Extent represents >15%= 100% and Sea Ice Area represents >30% = 100%
Rather than having a 85% uncertainty you seem to prefer a 70% uncertainty.
Depending on the resolution changes used in the land masks throughout the monitoring period the results are equal to WAGs. Depending on the resolution changes in the satellite photos that were processed to arrive at the area or extent the results are equal to SWAGs. Then depending on the Al-Gore-rhythms used to refine the end results to correct for differences throughout the monitoring period the results go back to WAGs. We know there can be no Bias by the reporting agencies as they are disinterested researchers and do not get involved in making wild predictions about future states of the Polar Ice!
I thought sea ice area = 100% and that’s why it’s more uncertain. You seem to have described the 30% extent measure. Is that right?
-Scott
Any thing greater than 15 percent is considered 100 percent for extent and any thing greater than 30 percent is considered 100% for area. This is decided by the particular reporting agency as some do extent and some do area. They seem to use the same satellite photos but each has their own land mask an each has a unique algorithm for arriving at the results.
The percent is by PIXEL and I do not recall the surface area in each pixel. There is evidence that melt water pools will appear as no ice also.
Scott:
There has also been discussion of clouds contributing to uncertainty. But claims that clouds are taken into account have been made.
Ice extent is the cumulative area of all grid cells that have at least 15% sea ice concentration. Ice area is the sum of the grid cell areas multiplied by the ice concentration for all cells with ice concentrations of at least 15%.
The area represented by each pixel differs with latitude due to the polar projection used to display the map.
Yes, I think you are right, the temperature seems to be climbing now… shame!
From NSIDC:
Ice extent
the total area covered by some amount of ice, including open water between ice floes; ice extent is typically reported in square kilometers.
Also from NSIDC
Daily and Monthly Total Ice-Covered Area and Total Sea Ice Extent
In computing the total ice-covered area and ice extent with both the NASA Team and Bootstrap Algorithms, pixels must have an ice concentration of 15 percent or greater to be included. Total ice-covered area is defined as the area of each pixel with at least 15 percent ice concentration multiplied by the ice fraction in the pixel (0.15 to 1.00). Total ice extent is computed by summing the number of pixels with at least 15 percent ice concentration multiplied by the area per pixel, thus the entire area of any pixel with at least 15 percent ice concentration is considered to contribute to the total ice extent.
There is a circular section over the Northern Hemisphere pole (known as the pole hole) which is never measured due to orbit inclination. For the purposes of ice extent, pixels under the pole hole are always considered to be at least 15 percent. For total ice-covered area, the pixels under the pole hole are not used. The Southern Hemisphere also has a pole hole, but it does not affect this sea ice data set because there is only land under this hole. For SMMR, the hole is 611 km in radius and is located poleward of 84.5 degrees North. For SSM/I, the hole is 311 km in radius and is located poleward of 87.2 degrees North. Note: The difference in pole hole areas between SMMR and SSM/I results in a discontinuity in the Northern Hemisphere ice-covered area time series across the instrument transition
From JAXA:
The area of sea-ice cover is often defined in two ways, i.e., sea-ice “extent” and sea-ice “area.” These multiple definitions of sea-ice cover may sometimes confuse data users. The former is defined as the areal sum of sea ice covering the ocean (sea ice + open ocean), whereas the latter “area” definition counts only sea ice covering a fraction of the ocean (sea ice only). Thus, the sea-ice extent is always larger than the sea-ice area. Because of the possible errors in SIC mentioned above, satellite-derived sea-ice concentration can be underestimated, particularly in summer. In such a case, the sea-ice area is more susceptible to errors than the sea-ice extent. Thus, we adopt the definition of sea-ice extent to monitor the variation of the Arctic sea ice on this site.
There is another group that uses 30% and only gives area But I do not recall the group.
Is that why Cryosphere is different for every one else?
The Y axis shift is fascinating
I don’t think the resolution that NSIDC satellite sensors is good enough to spot a lot of the open water down there, hence why it shows a high value. If you look at Bremen instead
http://www.iup.physik.uni-bremen.de:8084/amsr/antarctic_AMSRE_nic.png
It is very “rotten”. This would agree with their value for extent
http://www.iup.physik.uni-bremen.de:8084/amsr/ice_ext_s.png
which shows it about average and in agreement with cryosphere area.
Andy