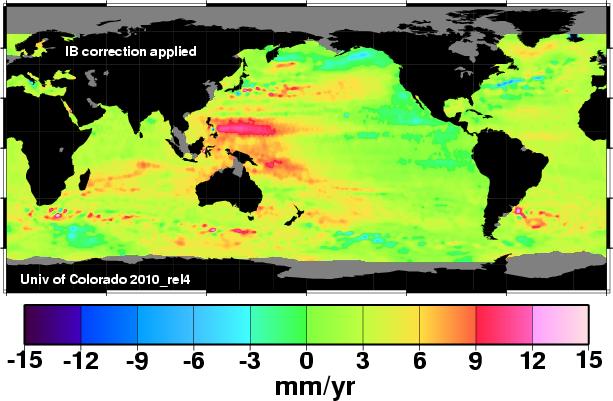
University of Colorado satellite altimetry shows sea level increases much higher than tide guages. East of the Philippines they show greater than 10 mm/year in a region where tide gauges show little or no sea level rise.
http://sealevel.colorado.edu/current/sl_ib.jpg
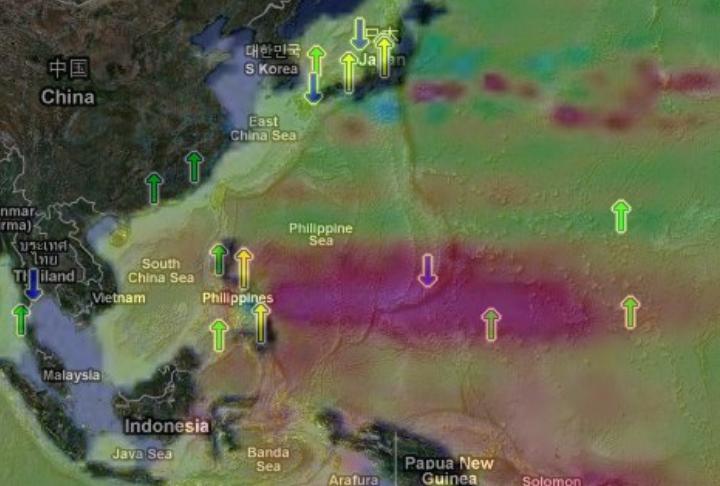
Below, I overlaid the NOAA tide gauge data on that region.The gauge at Guam is going down, while CU reports 10 mm/year. The arrow at Chuuk is rising only 0.6 mm/year and is shown in the 9.0+ region of the CU map.
http://tidesandcurrents.noaa.gov/sltrends/sltrends.html
Looks to me like the satellite altimetry data is not accurate, and probably should not be quoted before Congress.


http://green.blogs.nytimes.com/2010/11/15/roman-decadence-and-rising-seas/?src=me
Now they are using fish tanks to prove it
So why is Ephesus a couple km inland now if we want to use the same argument?
It is now inland because the harbour was slowly silted up by the river and has little to do with global sea levels.
Think of a number… any number… multiply by 10… divide by the number you first thought of… and the answer is 10 mm/year… simple really… satellite simple.
so how exactly does this satellite work? I mean there could be 10ft swells, how does it know any difference? Looks like someone went in with photoshop and air brushed the map