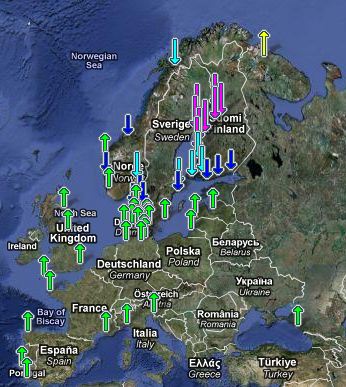
http://tidesandcurrents.noaa.gov/sltrends/sltrends.shtml
NOAA records fifty-five tide gauges in Europe. The average sea level “rise” is minus 1.08mm/year.
Only three locations out of fifty-five are rising faster than 2mm/year. Twenty three locations have falling sea level.
Average        -1.08
----------     -----
Murmansk        3.92
Cuxhaven        2.44
Tuapse          2.24
North Shields   1.88
Kalingrad       1.84
Newlyn          1.71
Sheerness       1.64
Lagos           1.50
Wismar          1.38
La Coruna       1.31
Cascais         1.27
Marseille       1.20
Genova          1.20
Warnemunde      1.20
Triesete        1.15
Espjerg         1.05
Fredericia      1.03
Brest           1.00
Gedser          0.94
Slipshavn       0.93
Maloy           0.93
Liepaja         0.88
Korsor          0.75
Aberdeen        0.66
Aarhus          0.56
Klagshamn       0.53
Kobenhavn       0.49
Stavanger       0.42
Hornbaek        0.25
Frederickshavn  0.16
Daugavgriva     0.16
Kungholmsfort   0.00
Goteborg       -0.13
Hirtshals      -0.20
Bergen         -0.52
Hamina         -1.03
Heimsjo        -1.61
Smogen         -1.92
Helsinki       -2.41
Hanko          -2.76
Landsort       -2.85
Narvik         -3.09
Turku          -3.71
Degerby        -3.77
Stockholm      -3.94
Oslo           -4.53
Mantyluoto     -5.96
Oulu           -6.38
Kaskinen       -6.54
Raahe          -6.81
Kemi           -7.01
Jakobstad      -7.32
Vaasa          -7.36
Ratan          -7.75
Furuogrund     -8.17


A good example of the Rock Solid land masses that are used as a reference for sea levels. Static sea level would be reason for concern because sea level is part of the dynamic processes earth goes through.
The sea level incline rate is an average, so sometimes it’s faster, sometimes it’s slower, sometimes it declines. Yay.
Raw data? Or adjusted for post-glacial isostatic rebound in Scandinavia? It’s noticeable that that’s where the big falls are.
Obviously gravity is chaotic and we don’t understand it. Perhaps there is a quantum connection between London and the newly discovered “bubbles” produced at our galactic core.
Anthropogenic sea level change – who knew?
Please note that the green cluster of upward arrows near Copenhagen does not indicate that
ElvisAl Gore has left the conference centre and flown home.Pingback: Se arriverà, sarà dal cielo, non dal mare | Climate Monitor