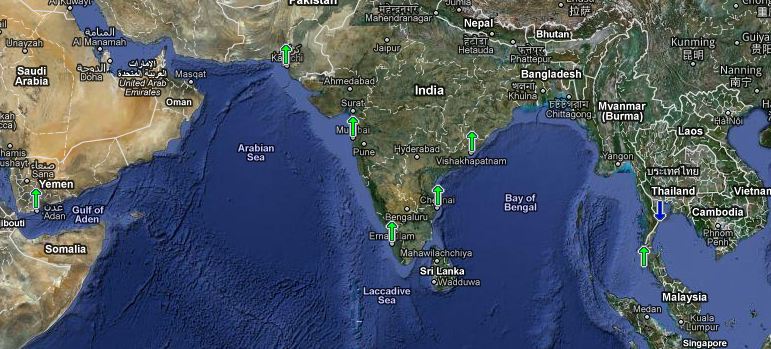
NOAA has seven tide gauges around the Indian Ocean, including Bangladesh, Pakistan, India, Yemen, Malaysia and Thailand. The average sea level rise rate is 0.59 mm/year, with all gauges reporting below the IPCC minimum forecast of 1.9 mm/year.
http://tidesandcurrents.noaa.gov/sltrends/sltrends.shtml
All of these gauges saw most of their sea level rise prior to 1950, and graphs have been flat to down since then. At current rates, it will take infinity years to see one metre of sea level rise.
Average	                0.59
Karachi	                0.48
Mumbai	                0.74
Cochin	                1.37
Madras	                0.31
Vishakhapatnam	        0.54
Ko Taphao	        0.49
Aden	                1.23
Ko Lak	               -0.48


Infinity plus one!
Now, since global temperature rise causes ocean expansion, where is the result of those GISS “hottest year evah!” values in the tide guage record? Couldn’t possibly be indicative of ….. errrr …. falsi…..errrr……over-adjusted readings?
I thought the satellites showed an increase in sea level since 1979 and I was ready to jump on that statement because of PDO shifting just before the satellites.
The prior to 1950 was probably due to positive PDO phase and recovery from LIA. I think what has been experienced since 1950 is just after affects from the recovery that continued until recently and we are at a period of waiting for the shift to become more obvious.
Slightly O/T (but justified by the fact that the Maldives are on your map (:-) :
I was reading some interesting stuff on the Geoid (actual real science) and how the level of the sea actually aligns itself according to equal gravitional force exerted by the Earth, which in turn depends on the content of the underlying crust.
Did you know that sea “level” (a misnomer in itself) is actually 180 feet higher (ie : further from the centre of the Earth) off the coast of New Guinea, than it is over the Maldive Islands.
To the people trying to measure sea “level” to an accuracy of one-hundredth of a millimetre, I say “good luck!”
Who ya gonna believe … data from some dodgy old piece of equipment or the well honed data points of a carefully crafted computer model ?
/sarc off
very unscientific steve.
you must specify what size of infinity.
“the IPCC minimum forecast of 1.9 mm/year.”
Can you provide a link to the forecast stating that is what to expect in 2010?
Greater than zero
“All of these gauges saw most of their sea level rise prior to 1950, and graphs have been flat to down since then.”
Steve I’m a sceptic and I only asked for a link to support your claim. Where has the IPCC stated what the minimum sea level rise should be this year?