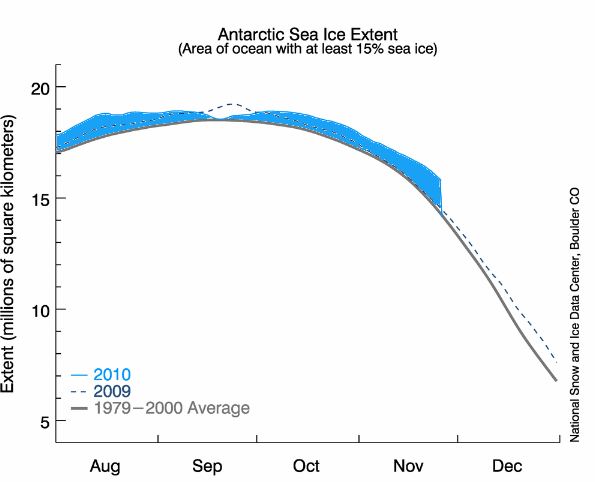
Blue area shows ice excess since August 1. On average, there have been more than 640,000 km^2 (10,000 Manhattans) of excess ice.
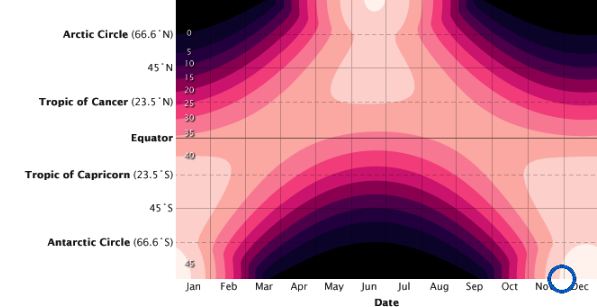
Peter Sinclair claimed in his hack attack piece that the excess does not occur when the sun is high in the sky. But the blue circle below shows that he has it backwards. We are at peak anomaly now, and the sun is almost at it is maximum. The Earth is closest to the Sun this time of year too.
http://earthobservatory.nasa.gov/Features/EnergyBalance/page3.php


He does that because he is a believer in the AGW hypothesis and will go to any lengths to support it.
you can’t let the truth get in the way of good propaganda.
in fact, the best propaganda is simply the truth turned on its head
Perhaps you would like to highlight the whole of the time the Antarctic shows a positive anomaly in the last couple of years (~July through to ~Dec) and contrast that with the whole of the time the Arctic shows a negative anomaly (100% of the time, but particularly ~May through to ~November).
Picking a single date, whatever that date, would be dishonest – and I’m sure you’re not.
Looks to me like the entire graph is above normal.
Antarctic positive anomalies occur at low latitudes of 60 degrees, where the sun has a low angle of incidence.
By contrast, Arctic negative anomalies occur late in the summer at high latitudes >80 degrees where there is very little solar energy being received. The Arctic anomaly in June is very small.
Steven:
Latitude, ocean atmosphere weather patterns, currents, wind direction and speed, along with a few other possible factors have nothing to do with ice at the poles. It is the concentration of CO2 in the atmosphere that is causing the changes.
NSIDC has shown that for sea ice 20 years is the correct climate base and it represents a reliable historic average of sea ice because before 1979 sea ice extent was constant.
Whether sea ice is inside a bowl of geothermal activity of surrounding a continent larger than the North American continent makes no difference because sea ice is sea ice. If the sea ice was in the Chesapeake bay it would still be measured the same. The fact there are no ice shelfs off Long Island are evidence of catastrophic global warming.
History shows us that on average New York is covered by a glacier more than 50% of the time. Just the loss of Berengia because of rising sea levels should have been a wake up call to the citizens of the world that they were causing global warming.