? “Virginia is for Warmers” ?
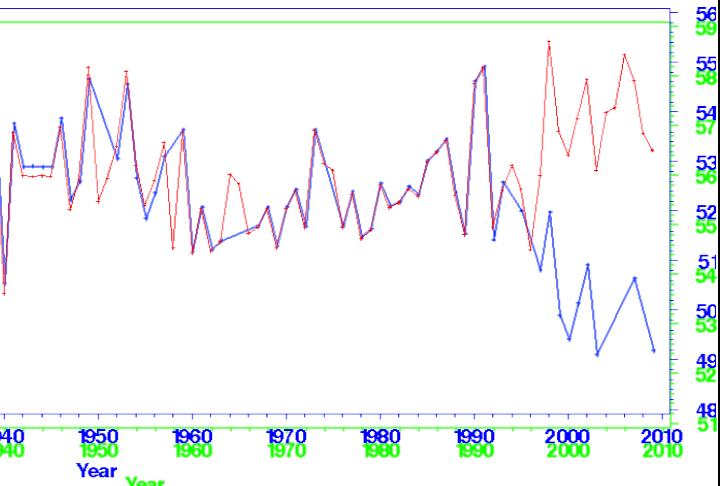
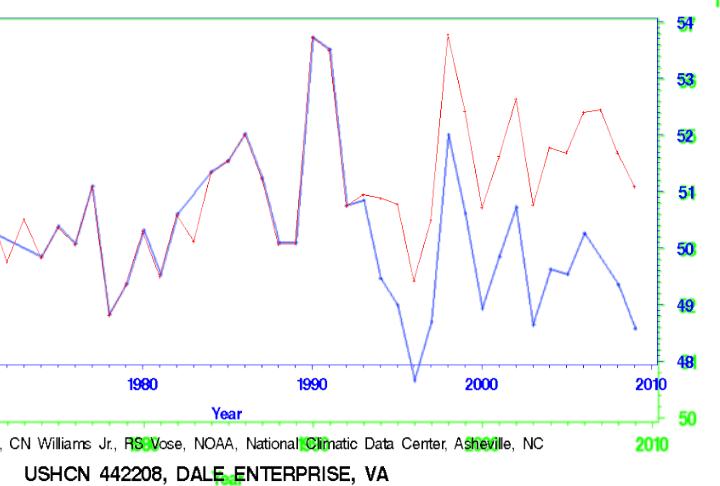
Yet another location near Washington D.C. where USHCN has converted a cooling trend into a warming trend.
Like Lincoln, Dale Enterprise VA shows a steep cooling trend (blue line) after 1990. And also like Lincoln, USHCN has flipped the cooling trend into a warming trend (red line.)
The graph below a similar “adjustment” made for Lincoln, Virginia.

These two stations are 120 miles apart. How is it that they both needed to be changed from a cooling trend to a steep warming trend after 1990?
https://realclimatescience.com/2010/11/05/imaginary-temperatures-in-washington-go-viral/


So is there any way to find out, or anyone to ask, for the reasons behind the adjust. I would really like to know what they may be . . .
. . . or is this a question that will never get an answer . . . ?
Another work of fiction.
Steve, can you produce a single post demonstrating all the frauds like this one put together. I’ve been alerting all to Steve’s climate audits dissection of Phil Jones uhi failure and this would go hand in hand.
Steve
I have found this account of how NOAA and NCDC ‘adjust’ temperature records:
http://www.ncdc.noaa.gov/oa/climate/research/ushcn/ushcn.html#QUAL
As an architect I find it difficult to follow within any reasonable time frame and would very much like to see a careful review and explanation of the process outlined here.
Thanks for your blog!
Hi Stuart
I think what this means is that if 2 locations show cooling but 1 shows warming, then the 2 are regarded as anomalous and changed to the warmer one (which is probably affected by UHI anyway.
I don’t see any stations in the region that show warming in the raw data.