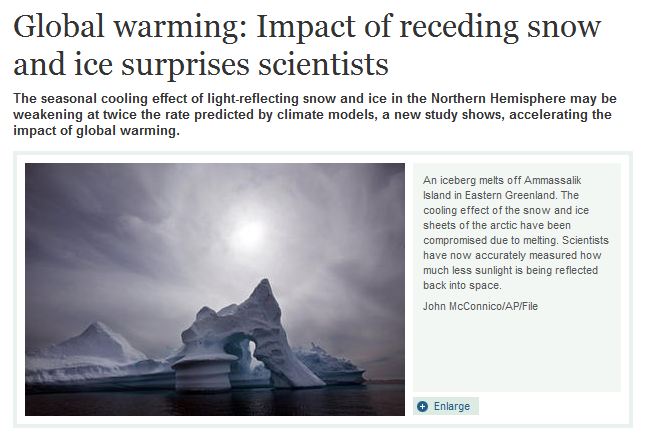
To get a job as an environmental reporter, you apparently need to demonstrate that you are incapable of logical thought.
Disrupting the Borg is expensive and time consuming!
Google Search
-
Recent Posts
- Gaslighting 1924
- “Why Do You Resist?”
- Climate Attribution Model
- Fact Checking NASA
- Fact Checking Grok
- Fact Checking The New York Times
- New Visitech Features
- Ice-Free Arctic By 2014
- Debt-Free US Treasury Forecast
- Analyzing Big City Crime (Part 2)
- Analyzing Big City Crime
- UK Migration Caused By Global Warming
- Climate Attribution In Greece
- “Brown: ’50 days to save world'”
- The Catastrophic Influence of Bovine Methane Emissions on Extraterrestrial Climate Patterns
- Posting On X
- Seventeen Years Of Fun
- The Importance Of Good Tools
- Temperature Shifts At Blue Hill, MA
- CO2²
- Time Of Observation Bias
- Climate Scamming For Profit
- Climate Scamming For Profit
- Back To The Future
- “records going back to 1961”
Recent Comments
- Bob G on Gaslighting 1924
- John Francis on “Why Do You Resist?”
- conrad ziefle on Gaslighting 1924
- Bob G on Gaslighting 1924
- Bob G on Gaslighting 1924
- Bob G on Gaslighting 1924
- conrad ziefle on Gaslighting 1924
- Bob G on Gaslighting 1924
- Bob G on Gaslighting 1924
- arn on Gaslighting 1924


The MSM all appear to take one garbage study and twist in to whatever fits their agenda. CSM should stick to their own faith based religion rather than dabbling in pathological science also!
My little dog hates the retreat of snow and ice. She gets so used to doing her bizness on it that she finds less and less area to do her stuff as it retreats.
This is a serious problem !! We need more snow and ice ——- wait …. snow has started — good……never mind
This is maddening. There is no basis for the premise! Steve, while you like to show winter, I’ll show the other two seasons…..
http://climate.rutgers.edu/snowcover/chart_seasonal.php?ui_set=nhland&ui_season=4
and
http://climate.rutgers.edu/snowcover/chart_seasonal.php?ui_set=nhland&ui_season=2
Some one please correlate temps to snow coverage or visa versa. Neither one lags the other sometimes when its hot the snow coverage is high, other times when its cold the snow coverage is low, other times it is high/high or low/low. It’s crap! And it takes all of a few of constant interrupted hours to see this with a simple Excel program. I’ve looked and can’t find it even looking for obscure connections. How do they get by with this?
Christian Science Monitor
Pray to God Screw the the science and people.