Whatever lies it takes to keep funding alive.
Disrupting the Borg is expensive and time consuming!
Google Search
-
Recent Posts
- Gaslighting 1924
- “Why Do You Resist?”
- Climate Attribution Model
- Fact Checking NASA
- Fact Checking Grok
- Fact Checking The New York Times
- New Visitech Features
- Ice-Free Arctic By 2014
- Debt-Free US Treasury Forecast
- Analyzing Big City Crime (Part 2)
- Analyzing Big City Crime
- UK Migration Caused By Global Warming
- Climate Attribution In Greece
- “Brown: ’50 days to save world'”
- The Catastrophic Influence of Bovine Methane Emissions on Extraterrestrial Climate Patterns
- Posting On X
- Seventeen Years Of Fun
- The Importance Of Good Tools
- Temperature Shifts At Blue Hill, MA
- CO2²
- Time Of Observation Bias
- Climate Scamming For Profit
- Climate Scamming For Profit
- Back To The Future
- “records going back to 1961”
Recent Comments
- Bob G on Gaslighting 1924
- John Francis on “Why Do You Resist?”
- conrad ziefle on Gaslighting 1924
- Bob G on Gaslighting 1924
- Bob G on Gaslighting 1924
- Bob G on Gaslighting 1924
- conrad ziefle on Gaslighting 1924
- Bob G on Gaslighting 1924
- Bob G on Gaslighting 1924
- arn on Gaslighting 1924


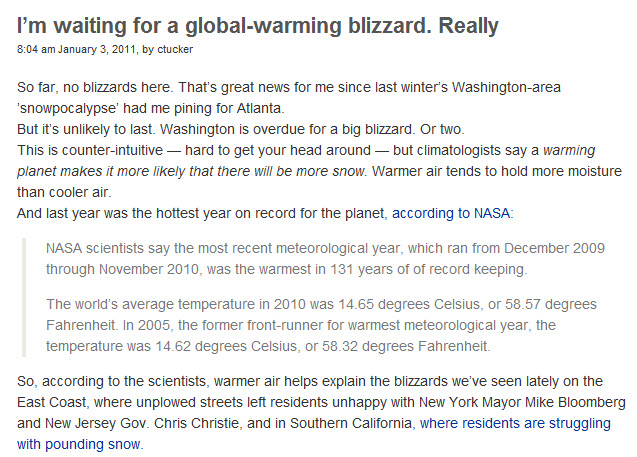
Why are they measuring December thru November. What’s wrong with Jan – Dec???
I guess they are afraid of the extreme lows from December 2010.
If memory serves, there was an email in the climategate mails where a couple of the cabal were laughing about releasing yearly data before everyone went off on holidays.
Meterological year starts with Winter which is considered as December January February!
Using Jan, Feb and the following Dec to represent a winter does not make sense. Using JFM to represent winter also does not make sense. It was based on a seasonal thing!
However they all need to pick a period as base reference and all use that for ALL claims. They also have to pick a reference period of years for Climate reference and all use the same period as different periods give different anamolies. Because none of the data are fixed attempting to adjust one to match the other is futile. Of course we have seen the futility of attempting to match one years reports to one from a few years later from the same source.
Which ever period provides what is needed to support the agenda is what will be stated!
we should see a lot more of this latest line of bull from all the puppets now that their strings have been pulled and they have been reprogrammed to believe warm causes cold and snow!
Here is a chart I made from ESRL/NOAA data to look at relative humidity in the atmosphere. I did this for numerous heights in the atmosphere to verify the warming = more water vapor claim.
http://www.esrl.noaa.gov/psd/cgi-bin/data/timeseries/timeseries.pl?ntype=1&var=Relative+Humidity+%28up+to+300mb+only%29&level=300&lat1=-90&lat2=90&lon1=-180&lon2=180&iseas=1&mon1=0&mon2=11&iarea=1&typeout=2&Submit=Create+Timeseries
Their is a steady decline in Atmospheric RH since 1950 so where Trenberth is getting his 4% increase in the last 30 years is a mystery. Tucker then regurgitates the hottest year green shirt/GISS talking points before other data sets are out. RSS is official at .51C anomaly for 2010 as compared to .55C for 1998. Professional journalism is a lost art to Ms. Tucker with respect to the linked article.
the sad thing is people will simply accept the warmer=colder argument.