Disrupting the Borg is expensive and time consuming!
Google Search
-
Recent Posts
- “Why Do You Resist?”
- Climate Attribution Model
- Fact Checking NASA
- Fact Checking Grok
- Fact Checking The New York Times
- New Visitech Features
- Ice-Free Arctic By 2014
- Debt-Free US Treasury Forecast
- Analyzing Big City Crime (Part 2)
- Analyzing Big City Crime
- UK Migration Caused By Global Warming
- Climate Attribution In Greece
- “Brown: ’50 days to save world'”
- The Catastrophic Influence of Bovine Methane Emissions on Extraterrestrial Climate Patterns
- Posting On X
- Seventeen Years Of Fun
- The Importance Of Good Tools
- Temperature Shifts At Blue Hill, MA
- CO2²
- Time Of Observation Bias
- Climate Scamming For Profit
- Climate Scamming For Profit
- Back To The Future
- “records going back to 1961”
- Analyzing Rainfall At Asheville
Recent Comments
- Bob G on Climate Attribution Model
- Bob G on Fact Checking NASA
- arn on Climate Attribution Model
- Bob G on Climate Attribution Model
- Bob G on Climate Attribution Model
- Bob G on “Why Do You Resist?”
- Gerald Machnee on Fact Checking The New York Times
- Gerald Machnee on Climate Attribution Model
- Gerald Machnee on “Why Do You Resist?”
- arn on Climate Attribution Model
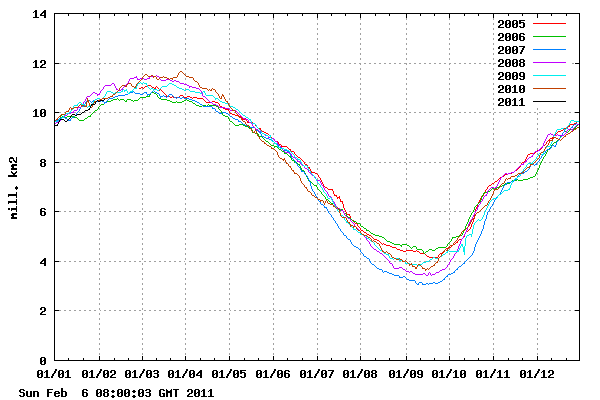
Arctic Ice Extent Same As 2005, And Greater Than 2006
This entry was posted in Uncategorized. Bookmark the permalink.


Again, years clustered to the point of not having any statistical difference or significance.
Andy, I’ve always said who cares what it does at the extremes, in May and Jan it’s always the same
I’ve always said who cares what it does ever.
Just for fun, have any of you guys ever plotted what an “ice free” Arctic looks like on that graph?
….that really puts those little wiggles in perspective
Yes…it abounds with dancing clowns and rainbows and funny games and unicorns and balloons and neverending lollipops and prizes and dancing dwarves and happy laughing and birds singing and babies giggling and everything that makes the world wonderful.
Why do you ask?
Even a thirty year history of Arctic ice extent tells us nothing about the extremes expected under normal conditions in that region. Anecdotal evidence shows that the extremes were greater just one and two hundred years ago and going back two to five thousand years the variations are even greater.
It turns out that the Arctic climate cycle is 80 years or there about so a 30 year window is not very useful. At least two cycles are needed to get some sort of picture. We must also remember the 1000 year warm climate cycle that gave us the MWP, and RWP.
The Arctic ice comes, it goes, but today is the only time it has been this bad. Mostly. And life in the Arctic will all die, and soon. Nobody and nothing survived when the Arctc REALLY warmed 6000 years ago, especially the Dorset people who had lost the knowledge of boat building and making bows and arrows. Just like us. The comparison is startling. Let’s all write our epitahs while we still have pen, paper and the ability to write.
The exaggerated importance of details is the rainson d’etre of the specialist researcher. The mating dance of different species of honey bees is a lifelong obsession with such a person. This microscopic focus has swept the MSM world. Everything of possible drama is linearly extrapolated to its absurd end. The Arctic ice will disappear because the “world” is heating by one or two degrees over a century. When I was travelling up the Dempster Highway in 2007 I met geologists studying exposures of permasfrost 700,000 old. Seeemed to have survived more than a little heating, like the ice cores of Greenland and the Antarctic. But none of this counts. Today is special.
I just read an incredible article (see Climate Depot) that all the snow and rain and hurricanes in Australia are the result of …. wait for it ….. the coming geomagnetic field reversal! The (new) science is settled! Disasters! End of society! A “river of water” equal to 50 Mississippis washing California into the sea!
Jerry Springer and Oprah speak only to those of little imagination. Global warming induced-Arctic ice loss or geomagnetic field reversals are end-of-time dramas that make every day we have left free from personal considerations or long-term responsibilities. Live for the moment, for tomorrow he universe shall smite us down.
The millenial desire for immolation reveals the self-involveds’ quest for punishment for an unidentified guilt about being well and prosperous in an unequal and unfair world. We live in the Medieval Era Redux. God is watching us, and He isn’t happy. If it weren’t for the precence of a 2011, PC-equivalent of Jim Jones, Al Gore or the IPCC, all this would be fascinating human comedy. Or tragedy. Possibly farce. When it comes to human behaviour, there’s little difference.
No ice in the Arctic (let’s not talk about the Antarctic, okay?). Five inches of snow in Dallas on the Superbowl. Wildfires in the Russian interior (unlike any, well, any since the early 20th century or all those earlier ones). Cyclones in Australia and floods unlike any except those other ones of our parents’ generation. All weather, but of course weather can be considered a proxy for climate, especially if you only consider significant how things were since you were a child, the rest being anecdote requiring adjustments.
I need a drink with all this worry of my impending doom. Not beer, though. It is fizzy with CO2.
Damn that’s good. If I were a drinking man I’d raise a toast to you. I will anyway. Here’s an uplifted mug of steaming Folgers. Cheers!
Yes…but what about the dancing clowns and rainbows and funny games and unicorns and balloons and neverending lollipops and prizes and dancing dwarves and happy laughing and birds singing and babies giggling and everything that makes the world wonderful?
Surely, the climate cannot be stable without these all-important components.
deniers denying
You are correct. It is very hot outside and all the ice is melting.
Actually, the correct, accepted practice & terminology for referring to sensible skeptics Poking fun at a silly theory is; skeptics being skeptical.
Someone ring up the grundain to see if they’re missing a hysterical nutcase!
We ought to develop an ensemble of all the ice sites… it will leave us less open to charges of cherry picking. As much as I am confident my forecast for the ice melt season to leave us at 05-06 levels or higher, as of this writing alot of the other indices
are lagging compared to this ( again I believe in the end, they will catch up)
Thanks Joe. It looks like your forecasts have been spot on, in sharp contrast to the failures of the UK Met Office.
I am waiting for a Zellweger to appear in that graph. Sometime when the artic goes off peak.
I think I’ve got it now. . . . stevegoddard . . . you could be anyone, just about . . .
http://www.linkedin.com/pub/dir/Steven/Goddard
If you read my blog regularly you would know that I don’t live in California.
Dr. Robert H. Goddard . . . any relation? He was the rocket scientist . . . or is that just a coincidence?
Most people just think I am just “a real space cadet”! But, I am a curious person . . . sorry!
Regardless, your site is not bad . . . If it weren’t for Climate Depot, I would have never run across it . . .
http://stevengoddard.wordpress.com/2011/02/06/arctic-ice-extent-same-as-2005-and-greater-than-2006/
http://nsidc.org/arcticseaicenews/- See “February 2011 compared to past years”
The NSIDC plot shows February ice varying between about 14 and 15 square kilometers between 2005 and 2011. the Steven Goddard graph shows it varying between about 10.5 and 11.5 sq. km. Why the huge difference?
Professor David Karoly uses the NSIDC plot in a video on the AYCC site to show young people that the Arctic is doomed.
http://aycc.org.au/Resources/video/
Sorry I coud not put the graphs here.
DMI measures area of 30% concentration ice, vs. 15% for NSIDC, so DMI is always smaller.
Thanks for your prompt explanation, Steven.
I was also interested to see your article about the north Pole melting in 1926.
http://stevengoddard.wordpress.com/2011/03/18/may-16-1926-open-water-at-the-north-pole/
and
http://trove.nla.gov.au/ndp/del/article/46512872
Professor David Karoly ( School of Earth Sciences, University of Melbourne) uses the NSIDC plot in a video on the AYCC site to show young people that the Arctic is doomed. http://aycc.org.au/Resources/video/
I note that on the NSIDC site it says that “Including 2011, the February trend is now at
-3.0 percent per decade.” The NSIDC graph used by Professor David Karoly makes the decline look much steeper through it choice of scale and elimination of the zero point on the vertical axis.
In Australia there is a global warming sceptic race horse!!
http://belesprit09.wordpress.com/2011/03/19/globalwarmnsceptic-190311/