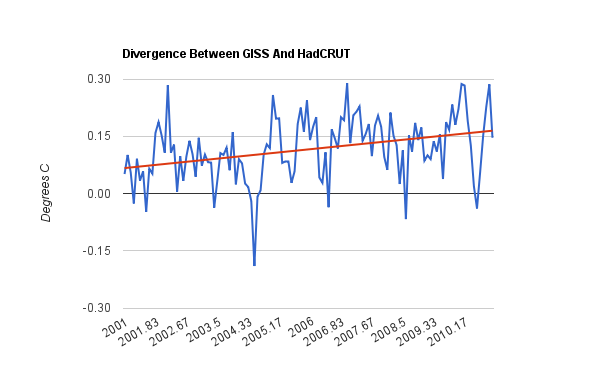
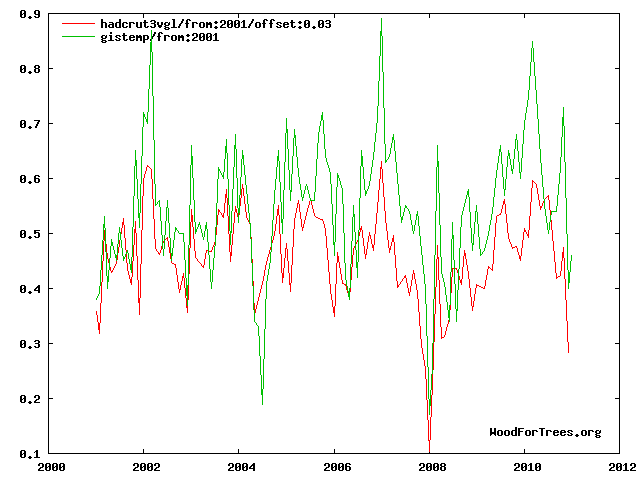
Hansen claimed last year was the “hottest year ever” by 0.01 degrees. Over the last decade he has diverged from HadCRUT by an order of magnitude more than his claimed record.
A good scientist would acknowledge that his error bar was much greater than his claim. In fact, he wouldn’t even make the claim.


It’s all in the math…
..nothing measures 1/100th of a degree
Math, admittedly, not being a strong point of climatologists. See Steig’s admission in his critique of O’Donnell.
There might be a very simple explanation….
…their office is above Tom’s Restaurant
RHI – restaurant heat island
lol
Do they serve booze in that place?
I thought it was Tom’s Diner. Suzanne Vega said she was there when she wrote this.
http://www.youtube.com/watch?v=T9XfPvA-Dec
GISS diverging from HadCRUT by more than 1 degree C per century? What!
Allow me to be the first to say: “It’s worse than we thought!”
Steve,
I’ve been talking to a warmist about your comparisons and he linked me to http://www.woodfortrees.org/notes#baselines telling me that your comparisons are wrong, because the two data set starts in different decades making them uncomparamble without adjustments described in that link…
Well he is wrong. I am plotting differences in temperatures, not absolute temperatures. The slope of a line (a) is independent of its offset (b).
ax + b = y
There was a very close correlation between GISS and HADCRUT temperature anomalies throughout the 90’s.
Since then GISS has shot ahead.
http://woodfortrees.org/plot/hadcrut3vgl/from:1993/mean:12/plot/gistemp/from:1993/mean:12
The difference must grow as the trend for HadCRUT3 is negative in the new millenium; that cannot be accepted. That is also why GISS says the earth was warming in January 2011.
Quit denying the truth. Our new… errrr old information said all along that warming causes more cold and snow. What you deniers and the satellite data don’t get is that when warming causes cold air and more snow, the data must be adjusted to show that it was warming causing the cold in the first place. It is so obvious to any real scientist, I just don’t understand why you can’t grasp this simple concensus science.
So there are different methods of counting angels on the head of a pin! I never knew that.
lol, same method, just different results.
it’s the same, but it’s different
; o)
James Hansen has been diverging from reality for a long time.
Warmists can’t deal with real present data, that’s why they concentrate efforts on future projections.
Hi Stephen,
You can see the divergence more clearly if you add OLS trends:
http://www.woodfortrees.org/plot/hadcrut3vgl/from:2001/offset:0.09/plot/gistemp/from:2001/plot/hadcrut3vgl/from:2001/offset:0.09/trend/plot/gistemp/from:2001/trend
I have used an offset of 0.09 which is my estimate from the notes that “HIQEntertainment” referred to. As you say, it doesn’t make any difference to the trends.
If you look at the raw data, you can see the annual trend (over this decade) is around -0.0029/yr for HADCRUT and +0.0064 for GISTEMP. That divergence adds up to pretty close to 1C per century, as you say.
The real question is, of course, whether a decade of data is really significant. Both trends are significantly less than the 30 year average, and the divergence there is only 0.1C per century out of a overall trend of 1.6-1.7C:
http://www.woodfortrees.org/plot/hadcrut3vgl/from:1981/offset:0.09/plot/gistemp/from:1981/plot/hadcrut3vgl/from:1981/offset:0.09/trend/plot/gistemp/from:1981/trend
I think it’s interesting to wonder why GISTEMP is diverging, but you haven’t yet disproven global warming as some might extrapolate… But if HADCRUT stays flat for another 20 years, that’s a different matter! Hopefully WFT will still be there to record it…
Best wishes
Paul
WFT