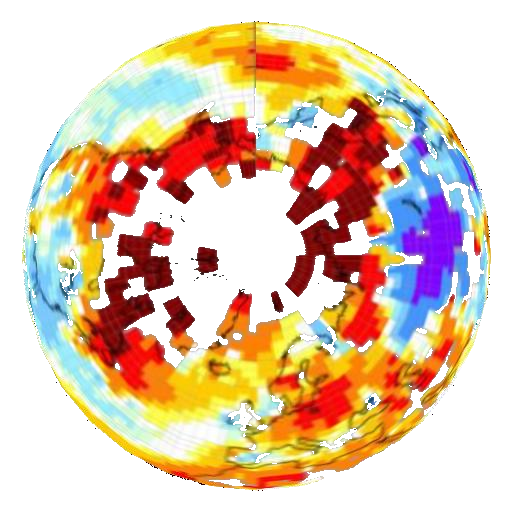
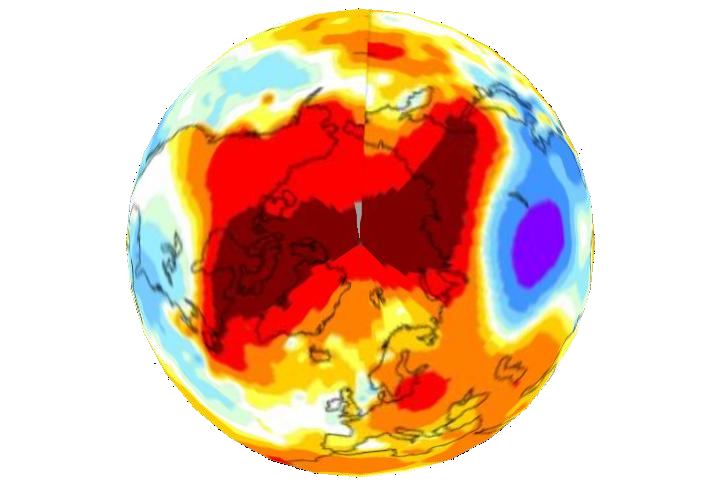
Last month GISS extrapolated the map on the left above (white is missing data) to the map on the right. Their algorithm creates a map showing almost the entire Arctic 2-11 C above normal. Their extrapolated data significantly skews the global temperature reading upwards. Hansen claimed a record in 2010 by only 0.01 degrees, yet he is creating artificial data 1000X larger. No serious scientist would make such a claim.
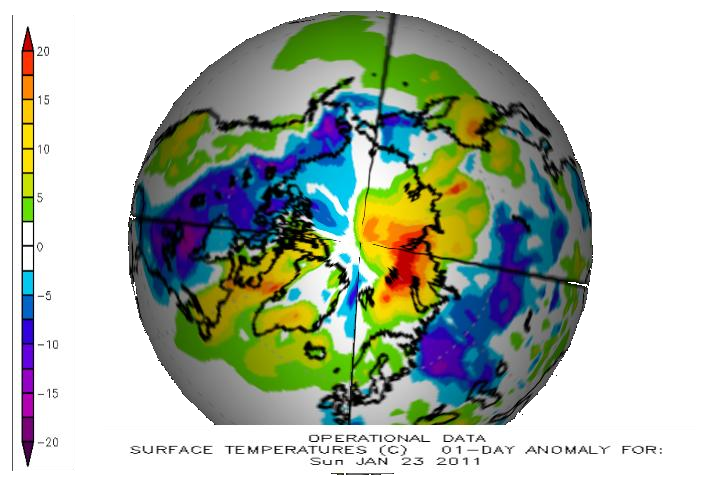
Now, let’s look at what is really happening in the Arctic, using the NOAA map below. On any given day, some parts of the Arctic are above normal and some parts are below – as much as 10C below normal. Large gradients can exist across small distances.
In other words. the GISS 120o km extrapolation algorithm is severely skewed, and pushes their calculated temperature numbers upwards by a large amount.
http://www.esrl.noaa.gov/psd/map/images/fnl/sfctmpmer_01a.fnl.anim.html


In other words. the GISS extrapolation algorithm is severely skewed
Surely a typo… dont you mean: screwed
lol, well, the skew screws it.
And they never get called on it. They just keep doing it and everyone pretends there’s some veracity to the method.
The NOAA is not much better. It uses its own massage techniques.
There will no doubt be plenty of missing data from Oklahoma, Texas and New Mexico when they get around to crunching their 2011 numbers.
Inevitably the Arctic anomalies will turn negative. What will that crooked fraud do then?