http://metofficenews.wordpress.com/2011/01/20/2010-a-near-record-year/
Disrupting the Borg is expensive and time consuming!
Google Search
-
Recent Posts
- “Why Do You Resist?”
- Climate Attribution Model
- Fact Checking NASA
- Fact Checking Grok
- Fact Checking The New York Times
- New Visitech Features
- Ice-Free Arctic By 2014
- Debt-Free US Treasury Forecast
- Analyzing Big City Crime (Part 2)
- Analyzing Big City Crime
- UK Migration Caused By Global Warming
- Climate Attribution In Greece
- “Brown: ’50 days to save world'”
- The Catastrophic Influence of Bovine Methane Emissions on Extraterrestrial Climate Patterns
- Posting On X
- Seventeen Years Of Fun
- The Importance Of Good Tools
- Temperature Shifts At Blue Hill, MA
- CO2²
- Time Of Observation Bias
- Climate Scamming For Profit
- Climate Scamming For Profit
- Back To The Future
- “records going back to 1961”
- Analyzing Rainfall At Asheville
Recent Comments
- Bob G on Climate Attribution Model
- Bob G on Climate Attribution Model
- Bob G on Fact Checking NASA
- arn on Climate Attribution Model
- Bob G on Climate Attribution Model
- Bob G on Climate Attribution Model
- Bob G on “Why Do You Resist?”
- Gerald Machnee on Fact Checking The New York Times
- Gerald Machnee on Climate Attribution Model
- Gerald Machnee on “Why Do You Resist?”


and if it wasn’t for the El Nino and PDO, we would be in a negative trend…..
…and if this trend continues
Their “Long Range Forecaster” needs to find another line of work. Crystal gazing and Tarot reading are viable options with his reputation and accuracy!
I predict that the Sun will continue to get higher in the sky in the US until June.
I’d go with tea leaves……..
14.5C? I thought the global mean was 15C. Let it warm let it warm let it warm.
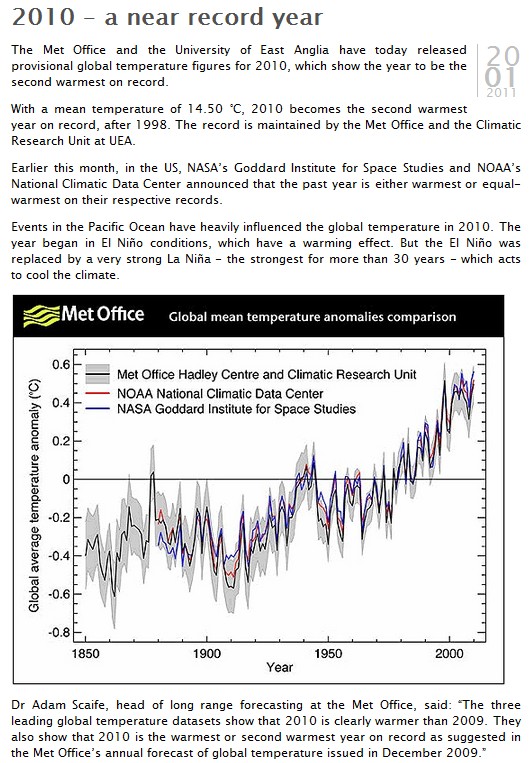
That silly chart looks so drastically steep because every year with the exception of 10 individual years over a 130 year range (1849 -1980) is graphed as anomalously cold. If that makes sense to any statistician or scientist then they need their credentials publicly stripped so they can do no further harm.
Going from -.4 in 1850 to +.6 in 2010 (exagerating at the extremes), thats 1.2 degrees in 160 years using the warmist’s questionable data…..
This should be the question that gets asked of every alarmist.
“Exactly how many degrees warmer is it today than it was in 1930?”
Wow, looks like the 1930’s were quite chilly! Brrrrrrrrrr. Amazing that they all independently came to the same revisionist conclusion, completely on their own, no colluison or collaboration, just great minds thinking alike.