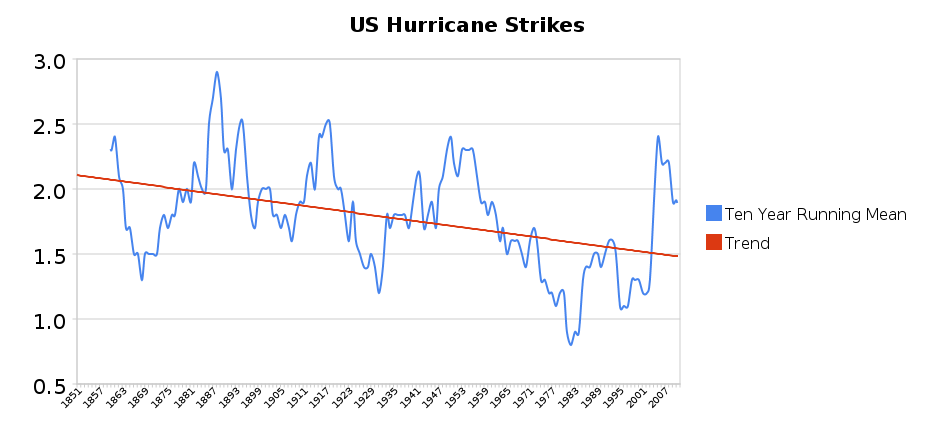
Y-axis is the ten year running mean of the number of strikes per year. The 1880s was the worst decade for hurricanes.
Disrupting the Borg is expensive and time consuming!
Google Search
-
Recent Posts
- Gaslighting 1924
- “Why Do You Resist?”
- Climate Attribution Model
- Fact Checking NASA
- Fact Checking Grok
- Fact Checking The New York Times
- New Visitech Features
- Ice-Free Arctic By 2014
- Debt-Free US Treasury Forecast
- Analyzing Big City Crime (Part 2)
- Analyzing Big City Crime
- UK Migration Caused By Global Warming
- Climate Attribution In Greece
- “Brown: ’50 days to save world'”
- The Catastrophic Influence of Bovine Methane Emissions on Extraterrestrial Climate Patterns
- Posting On X
- Seventeen Years Of Fun
- The Importance Of Good Tools
- Temperature Shifts At Blue Hill, MA
- CO2²
- Time Of Observation Bias
- Climate Scamming For Profit
- Climate Scamming For Profit
- Back To The Future
- “records going back to 1961”
Recent Comments
- Robertvd on Gaslighting 1924
- conrad ziefle on Gaslighting 1924
- arn on Gaslighting 1924
- Gordon Vigurs on Gaslighting 1924
- Bob G on Climate Attribution Model
- conrad ziefle on Climate Attribution Model
- Ohio Cyclist on Climate Attribution Model
- Bob G on Climate Attribution Model
- Bob G on Climate Attribution Model
- Bob G on Fact Checking NASA


Yeah. Two other things.Shown in the data (not the graph); before the Civil War all hurricanes struck only Southern states but after the C.W. gradually them began to hit more Northern states. Also, (not shown in either data or graph) it appears to me that more storms are tracking much further north, and going up the Atlantic, or south and hitting Central America.
Has anyone kept count of those that miss the US vs. those that hit the US?
The Civil War must have released a lot of CO2. Are you being dense on purpose?
19th century satellite data is sparse, but I am pretty sure there was a big hurricane in the mid-Atlantic in 1834.
Michael
keep working that propaganda, keep working that propaganda
you sound an awful lot like Sense Seeker. are you him?
Michael,
to answer your question
Global Tropical Cyclone Accumulated Cyclone Energy [ACE] remains lowest in at least three decades, and expected to decrease even further…
http://www.coaps.fsu.edu/~maue/tropical/
Thank you for asking. Now everyone can see the decrease. Good work.
Overall, since 1979:
**Global Tropical Cyclone ACE shows no upward trend.
**Northern Hemisphere TC ACE shows no upward trend.
**Southern Hemisphere TC ACE shows no upward trend.
But who knows, in the 1880s, people were so stupid that maybe those were tornados or earthquakes rather than hurricanes!
Who do you trust to count hurricanes, those ignorant people back then or today’s National Hurricane Center? After all, there were 20 named storms this year and 28 back in 2005!