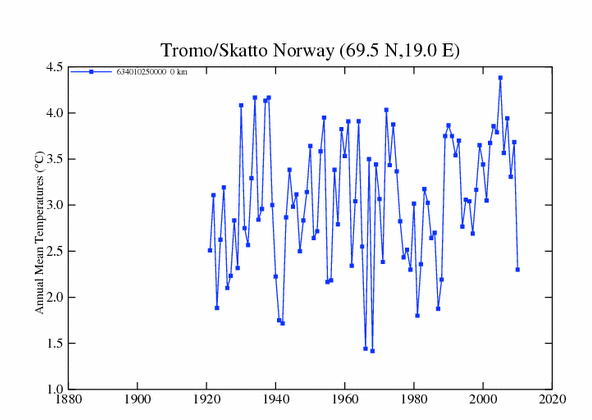
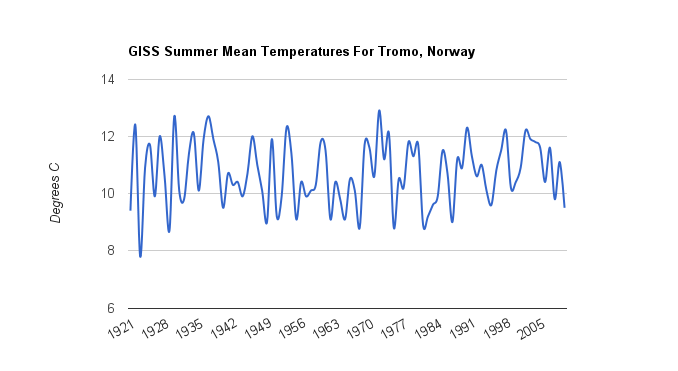
GISS reports that the average temperatures in Tromo, Norway during July and August, 1922 – were a cool 14.8 and 11.9 C.
But a newspaper report from the same summer shows extremely hot temperatures.

Tromso, for six weeks, has experienced temperatures ranging from 90 to 95 degrees Fahrenheit.
How do we verify that GISS historical records are accurate?
Spreadsheet here


Was the 12 C the GISS reported high? Assuming it’s the avg of high/low and a low of 60 F, then GISS should show 24.6 C (using an average high of 92.5 F). So they’re still way off the mark assuming that the number you’re giving for July/Aug is right (it’s not clear that it is…your graph doesn’t show that at all).
-Scott
It isn’t my graph. It is the GISS graph of average temperatures for the month.
Why does it say “Annual Mean Temperature” instead of “Monthly Mean Temperature”?
-Scott
Click on the GISS link on that page for monthly temperatures.
Wow.
Looking at the other years it looks like 14.8C and 11.9C aren’t very unusual values for those months so either the figures are wrong or tropical months are a regular occurence.
Interesting, so from your spreadsheet I get an average July temperature (1921-29) of ~53 F. This is just a touch over what the newspaper said of 51 F. Average July 1921 was 14.8 C, the hottest in the timespan, tied for first with 1927. Is there any evidence of the temps being extremely hot in 1927 too?
-Scott
We must continue to cool the past in order to show warming today.
They must have put Norway in a hot oven to cool it by 20-30 degrees.
lol…..yep
What does HadCrut do with it? Does anybody have quick access to their site specific data?
July, 2004 is also listed as 14.8 C for July. Is it possible to get detailed temperatures (i.e. daily highs and lows) for this more recent month? If the highs are not in the 90-95 F range, then that would show the skewing more definitively.
-Scott
Try this Scott, it gives you Tromso data from 1931-59, and since 2002. Nothing for the 1920’s though.
http://climexp.knmi.nl/gdcntmax.cgi?someone@somewhere+NO000001026+TROMSO+
As far as I can see, no maximum temps above 26C in July 2004.
Great find! This is turning quite interesting…in the link you posted, the graph didn’t even go above 30 C, and nothing went up to the top of the graph (at least not that I could tell)…even including the hotter years in the 1930s! So was the newspaper article just off by 10 F or so? That seems doubtful. The other possibility is that the lows during that time were lower than in the hot years in the 1930s or the 2000s either one, but that also seems doubtful, as I’d guess that the lows and highs for a specific site are correlated.
So we have a reported “six weeks” of high temps (32-35 C) in July/August and yet a July average of 14.8 C. So what does that mean? Well, it’s now been checked against time resolved Tmax data from 1931-1959 and 2002 onward…and Tmax in those time periods never went >30 C (and by the looks of it, never >29 C). However, from the GISS results in those time periods we see 1934 (15.4 C), 1937 (15.3), and 2004 (14.8) all equal to or higher than 1922. Also, 1954 was 14.7 C, very close to the purported 1922 temp.
It’s possible that the newspaper article was referencing a different thermometer…one placed in direct sunlight. But their reported average July temp agrees well with the GISS numbers…so I doubt it’s that. Could it be an artifact of smoothing/homogenization/etc?
Man I wish I had access to the raw data they used for that time series…
One question Steve – why is the spreadsheet labeled as “Troto”?
As an aside, THIS kind of discussion is what I’d like to see more of on this site, actual numbers, etc. I don’t care for rapid fire anecdotal stories or one liners. Too much like Joe Romm (and others) for my taste.
-Scott
There were dozens of reports out that summer about unprecedented heat in the Arctic The spreadsheet has the same name as the GISS data it comes from.
Click on “raw data” to view the individual figures.
You sort of just pick and plug for your daily posts right? So that means you just randomed up on Tromso.
Isn’t it odd how every random data point presented by GISS turns out to be another scandalous lie revealed by a slight scratch of its AGW paintjob.
So you too spotted that GISS couldn’t even get the name of the town and fjord right! Ha! I remembered that from grade 5 geography class.
I can’t cop to that Robert.
I was going by what Anything is possible said.
I did a post on Tromso this morning and then a reader sent over an article about a heatwave – which wasn’t shown in the GISS records. I probably should have just buried it for the good of the religion.
Bite your tongue. Don’t change a thing man.
It’s the fun thing about climate science, it’s so full of bullshit and lies you can hardly miss.
It’s like every hole the dog digs in the backyard turns up gold nuggets.
Isn’t it “Tromso” not “Tromo|?
What’s an “s” when you got numbers to move around? Busy people they are! They haven’t got time for accuracy!
Also note that knmi gives the co-ordinates of Tromso as 69.65N, 18.93E. This appears to be correct, as Google maps places that right in the middle of town.
GISS, on the other hand, places it at 69.5N, 19.0E, some 8 miles to the SSE.
See here :
http://maps.google.com/maps?q=69.65000153,18.93000031
Hansen’s “night-lights” nonsense which he uses to categorise Urban and Rural stations thus shows the Tromso thermometer in the middle of nowhere, presumably excuding it from any UHI effect which if, as I suspect, the thermometer is actually placed slap-bang in the middle of a town with a population of 43,000, is likely to be considerable….
Here’s something interesting……..
10250 697 -189 10 TROMSO/LANGNES NORWAY
10260 697 -189 100 Tromsoe NORWAY
The first number is the WMO number, the next two is Lat/Lon and the last is elevation. But, this is from Hadley,
http://www.cru.uea.ac.uk/cru/data/landstations/crustnsused.txt
I’m not finding the historical data but as I recall, they aren’t very forthcoming about that stuff anyway.
Are the two(GISS and HadCrut) really using 3 different stations?
Also, our friend Warwick Hughes(or one of his buddies) actually did a compilation and graphed the data….
http://www.warwickhughes.com/cdi09/10250.html
This is the link for the GISS co-ordinates :
http://maps.google.com/maps?q=69.5,19.0
Well, as you can see on the map, Tromsoe is farther north.
Very cool finding. Will you try to communicate such things to the people in BEST, the Berkeley Earth Surface Temperature record around Richard Muller etc.? They must have some algorithms to systematically judge whether some data from the past are corrupt etc. In some sense, newspaper articles of this kind can falsify some time series…
Good point Luboš. I’ll look into it.
The same stuff is happening in the USA. Ten years ago when I was deciding if I lived in the right area for a Heat-Pump, I gathered the Heating Degree Day (HDD) charts for various cities and my own. I wanted to compare how my heating load would compare with some friends and relatives that had heat-pumps. At that time there was a proliferation of data, with some charts going back to the early 1900’s, on the internet. Sometime last year I was trying to prove a point (HDD had not decreased, thus there was no warming) and did another search on the internet for these HDD charts. I could not find any historical HDD charts! None went back further than 1973, and some of those even said “corrected” to reflect new data – Huhhh!
You can even find “corrected” graphs that have a lower monthly degree day total for a city several hundred miles further north (not near a body of water)than another un-corrected city. What gives? What are they doing? What is there to correct about the reading, on the hour, at the designated weather station, and write it down on a spread-sheet, multiplying by hours times degrees (above 60)?
Where is this OLD HDD data? Who purged it? Is it still in the old newspapers, or are they going to burn them too?
You might want to correct this sentence;
“GISS reports that the average temperatures in Tromo,”
to
“GISS reports that the average temperatures in Tromsoe, “
I’m using the spelling which GISS used.
If you go here;
http://maps.google.com/
And enter
tromsoe
in the search, you will find the town.
It is known as Paris of Northern Norway, since there are so many restaurants and pubs there. Maybe it is the temperature in the pubs they measured?
If you go here;
http://maps.google.com/
And enter
Skattora 9018 Tromsø
Then you will find the exact place called skattoera in Tromsoe.
The writing “oe” is instead of one special norwegian letter which you dont have in the US. I guess you cannot see it if I enter it here; Ø
Skattora is an old “airport” for seaplanes. That can explain why there is a wheather-station there.