Masters said as the Earth gets warmer and more moisture gets absorbed into the atmosphere, it increases the chances of more extreme storms in all seasons which would be capable of causing greater impacts on society.
Masters pointed out that in each of the past two winters the northeastern United States has been hammered by three snowstorms that qualified as Category 3 storms or worse on the Northeast Snowfall Impact Scale.
“If the climate continues to warm,” he added, “we should expect an increase in heavy snow events for a few decades, until the climate grows so warm that we pass the point where it’s too warm for it to snow heavily.”
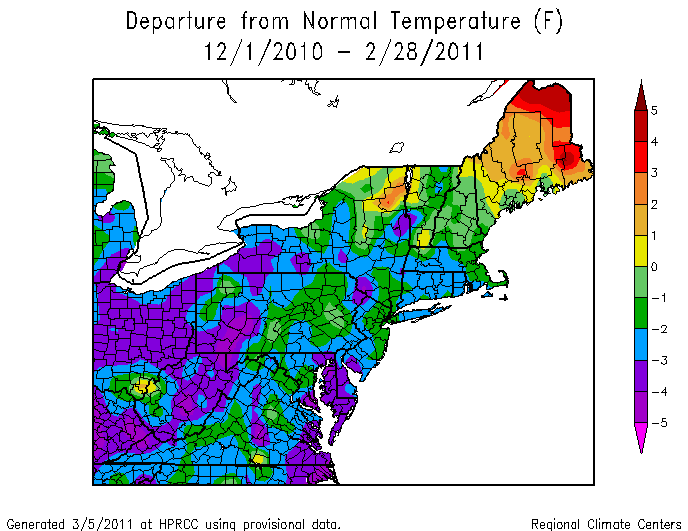
This is a fascinating theory, except that the region he is talking about had far below normal temperatures during the meteorological winter. Shouldn’t Jeff Masters have checked this out before going to the press?
http://www.hprcc.unl.edu/products/maps/acis/nrcc/Last3mTDeptNRCC.png
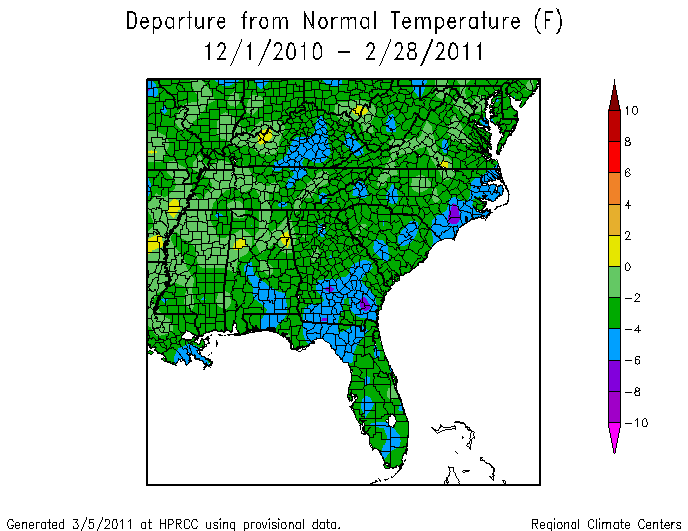
The southeast US also had far below normal temperatures.
http://www.hprcc.unl.edu/products/maps/acis/sercc/Last3mTDeptSERCC.png
Winter temperatures in the US are plummeting over the last decade.

http://www.ncdc.noaa.gov/oa/climate/research/cag3/na.html
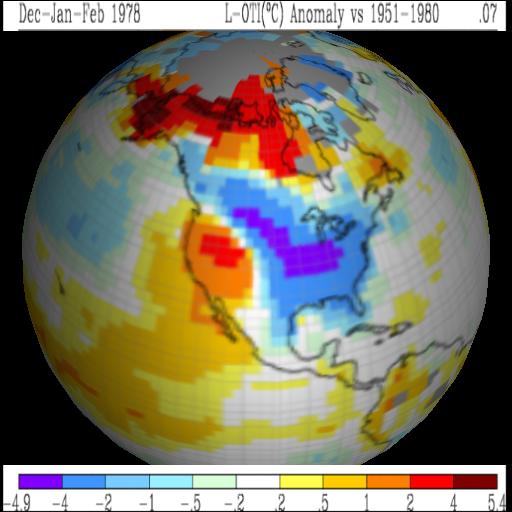
Snow is associated with cold winters, not warm ones. The snowiest winter in the Northern Hemisphere was 1978, which was also the coldest winter on record in the Eastern US.

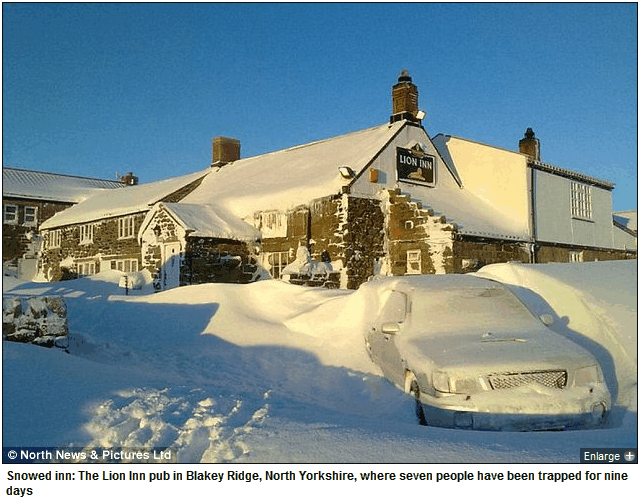
December 2010 was the second coldest on record in England, where records extend to 1659. Only 1890 was colder.
From a theoretical point of view, Master’s claim is also absurd. It takes very little water vapor to saturate air below 0C. There is never a lot of moisture in the air during a snowstorm, because cold air can’t hold a lot of water vapor.
Snow is associated with cold, not warmth. Only a global warming funded researcher could be ridiculous enough to convince themselves otherwise.


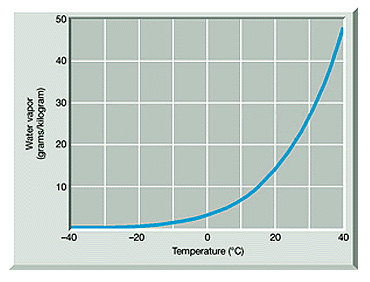

he’ll just reply that it was warm somewhere else and all that vapor magically ended up in the USA.
The atmosphere is only a few miles thick. How are they sneaking the warm moist air into the middle of a 2000 mile wide region?
Get your own climate model
http://www.bbc.co.uk/news/technology-12615599
“Fate of the World games explore climate change”
I’ll stick with Quake 3 Arena/Quake Live for a “real world experience” game.
They used different color scales for the Northeast and Southeast representations. It makes the pattern over the Southeast look less dramatic.
I realize it is deception from the source because that is what they are best known for!
They had to. There weren’t any warm regions in the SE, so the scale is shifted down.
How do you like the date on the top article, 03 MARCH 2011. More of the after-the-fact predictions that global warmers make.
Any global warmers like to tell me I’m wrong?
That is what is called “making it up on the fly”. These people seemed extremely determined to keep this nonsense going. Then sooner or later, we will have a bad heatwave or drought in the corn belt (as we always have over history), food prices will soar and they will scream “I told you so!”.
I expect that the 7-8 yellow spots in the SE regional map are all individual temperature stations with local site errors that bias the measured data to be high. That bias is then smeared over the general vicinity to plot the map. Two stations, one on the Ohio river along the WV-OH border and one to the southern side of VI are evident in the NE map.
Some of the local low temp spots may be bias errors to the low side.
Why don’t the well paid scientists that manage these systems use the data to investigate and correct the most obvious station problems and/or omit the erroneous stations from the plots, maps and analysis?
Shouldn’t Jeff Masters have checked this out before going to the press?
No need, he knows the press will reliably carry his water and not ask any inconvenient questions.
This is what happens when you can’t count on your death spiral any more.
Stupid Arctic! Die, damn you, Die!!!!
They’re gonna run out of explanations when the arctic begins advancing again. But that is likely more than a decade away.
I love you Nobama. You made me LOL. Thanks. The absurdity of the global warming group depresses me so much.
I got a comment. The following link shows relative and specific humidity graphs starting back since 1948.
http://www.climate4you.com/GreenhouseGasses.htm
There is no clear cut trend in increased humidity from those graphs. The reason I note this is because I’ve been reading that the snowier winters have to do with more water vapor in the atmosphere from AGW.
What am I missing here?
You can’t increase humidity in the winter. Winter relative humidities are already close to 100%.
I used to go to wunderground.com (the weather web site that Jeff founded) all the time. Once I realized that he is a global warming alarmist, I stopped going.
The chart demonstrated that warmer air can hold more water.
Winter air can also below saturation point.
Cannot warmer air produce higher levels or humidity for a greater number of days that will dump their contents as snow should a cold air mass send it skyward to condense?
The cavalier attitude about arctic ice loss is rather disturbing.
The basis for the prognosis of a return of the cap is based on what facts/models/crossed fingers?