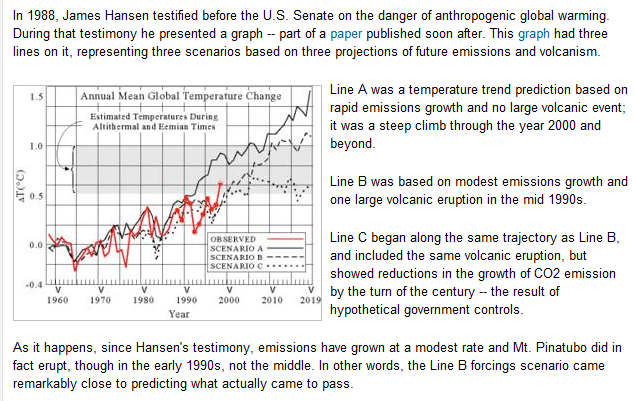
Marc Morano sent over this interesting piece from Grist in 2006. His Hansen comparison graph ends right at the peak temperature of 1998, he claims that CO2 “emissions have grown at a modest rate“, and he implies that the 1993 eruption of Pinatubo somehow affects the current climate.
http://www.grist.org/article/hansen-has-been-wrong-before/
Meanwhile, back in the real world – Hansen is way of the mark and CO2 emissions growth has doubled since the 1990s.
ScienceDaily (Dec. 8, 2006) — According to the co-Chair of the Global Carbon Project, CSIRO Marine and Atmospheric Research scientist Dr Mike Raupach, 7.9 billion tonnes of carbon were emitted into the atmosphere as carbon dioxide in 2005 and the rate of increase is accelerating.
“From 2000 to 2005, the growth rate of carbon dioxide emissions was more than 2.5 per cent per year, whereas in the 1990s it was less than one per cent per year,”
http://www.sciencedaily.com/releases/2006/11/061130190831.htm


I do not care how many times this comes up the answer is that Hansen Claimed and labeled Scenario A BAU (Business As Usual) It does not matter how many times a denier claims otherwise, in his testimony and in the related paper scenario A was the most likely projection until it failed. It was because of Hansen’s Magic graph that we have the Hockey Stick and most of the IPCC Bull.
In the middle of July turn off the air conditioning for the hearing room and open the windows on what would turn out to be the warmest day. It was a Dog and Pony Show and Hansen should have been discredited then but it fit the agendas of a variety of organizations and government agencies such as NASA so he became a cult hero and shining example for all the Chicken Little Criers that came since!
The Luke Warmers want us to give Hansen a pass on this as some believe he was “Misunderstood” and C is somewhat consistent with the projections!
This is one of the major defining points between a realist and a member of the Chicken Little Brigade and there is a definite line between the two.
I agree with Mike. Death train Hansen might have gotten a pass, had the study slipped to obscurity, and if he didn’t fiddle with the thermostat, and if he didn’t blather endlessly about being silenced. But, he did. He gets no pass. He was obviously wrong even though his predictions attempted to cover the board. Anyone claiming otherwise is either intentionally misleading people or they simply don’t examine basic numbers behind the CAGW theory.
Welcome back Steve. “Hansen is way of the mark”. Off?
Very well said, Mike.
Hansen said “It may be fruitless to search for an external forcing to produce peak warmth around 1940. It is shown below that the observed maximum is due almost entirely to temporary warmth in the Arctic. Such Arctic warmth could be a natural oscillation (Johannessen et al. 2004), possibly unforced. Indeed, there are few forcings that would yield warmth largely confined to the Arctic. Candidates might be soot blown to the Arctic from industrial activity at the outset of World War II, or solar forcing of the Arctic Oscillation (Shindell et al. 1999; Tourpali et al. 2005) that is not captured by our present model. Perhaps a more likely scenario is an unforced ocean dynamical fluctuation with heat transport to the Arctic and positive feedbacks from reduced sea ice.”
So in the 1930s/40s it was solar forcing of the AO, but this time it’s CO2. Two different causes producing identical phenomena….
See: http://appinsys.com/globalwarming/HansenModel.htm