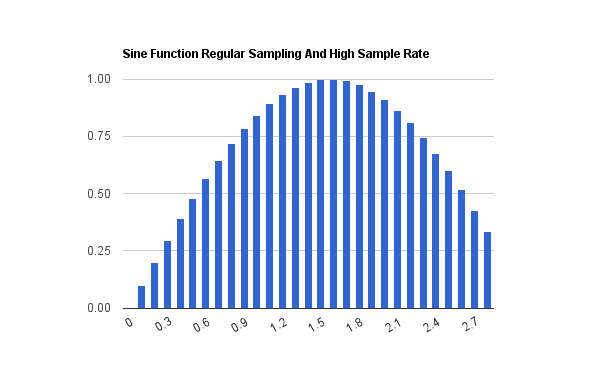
In the satellite era, we get very high, regular sample rates across almost the entire planet. This guarantees capture of minimums and maximums (like minimum pressure of a hurricane, or peak rainfall.) The graph above shows a sine wave with an adequate sample rate.
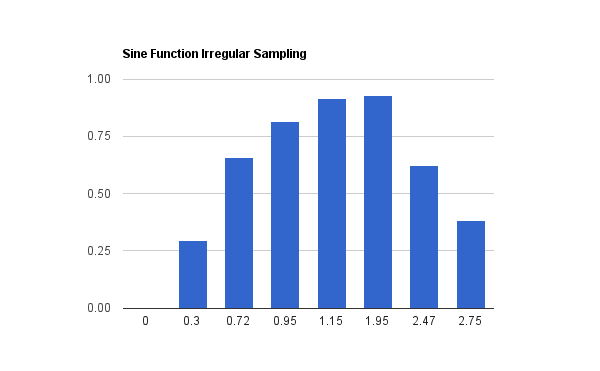
Looking at the same function with a lower, irregular sample rate – we see that the peak value is lower. This is analogous to collection of weather data prior to satellites and radar. Besides temporal sampling rates, another problem is the lower spatial sampling. During the 1930s, many mid-Atlantic hurricanes were probably missed entirely because there weren’t any viewers to report them.
Some scientists seem to be unable to comprehend the difference between more extreme weather data, and more extreme weather. If a 1935 hurricane were measured today, the minimum pressure would almost certainly be reported lower, simply because of the ability to sample data regularly on a finer grid, with finer time resolution.


Excellent post. Sometimes, the obvious needs stated.
“Some scientists seem to be unable to comprehend the difference between more extreme weather data, and more extreme weather.”
I don’t know if it is their inability to comprehend vs just plain disingenuous. Or is it a case of a bit of both?
Of course 30 years ago scientists worked out that colder global temperatures actually caused an increase in extreme weather events.
Meteorologists think that they can forecast the short-term results of the return to the norm of the last century. They begin by noting the slight drop in overall temperature that produces large numbers of pressure centers in the upper atmosphere. These break up the smooth flow of westerly winds over temperate areas. The stagnant air produced in this way causes an increase in extremes of local weather such as droughts, floods, extended dry spells, long freezes, delayed monsoons and even local temperature increases – all of which have a direct impact on food supplies.
http://www.denisdutton.com/cooling_world.htm
Of course this was back in the days when NOAA thought lower temperatures meant – well -lower temperatures.
A survey completed last year by Dr. Murray Mitchell of the National Oceanic and Atmospheric Administration reveals a drop of half a degree in average ground temperatures in the Northern Hemisphere between 1945 and 1968.
For some silly reason NOAA also thought the temperature changes had something to do with the sun.
And a study released last month by two NOAA scientists notes that the amount of sunshine reaching the ground in the continental U.S. diminished by 1.3% between 1964 and 1972.
http://www.denisdutton.com/cooling_world.htm
Of course we now know these scientists were all wrong as satellites confirmed that a large increase in NH snow cover in 1971.
According to George Kukla of Columbia University, satellite photos indicated a sudden, large increase in Northern Hemisphere snow cover in the winter of 1971-72.
As we now know, increased snow cover is really caused by global warming.
Exactly! They were trying to form the notion of coldwarm, now, we know they had it backwards!
The 1935 hurricane was measured 26.35″ on land. With today’s monitoring, it would have been interesting to see what the lowest pressure would have been. Or maybe it would have been so strong that no one would want to fly into it.