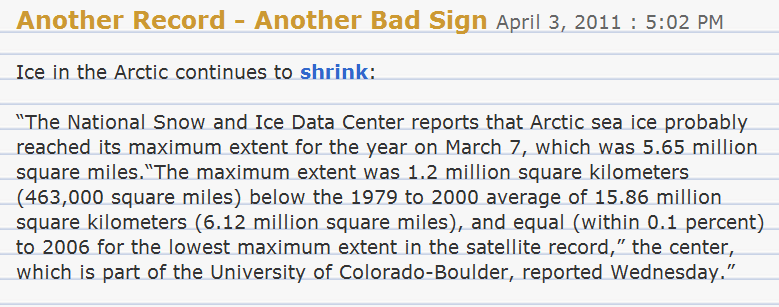
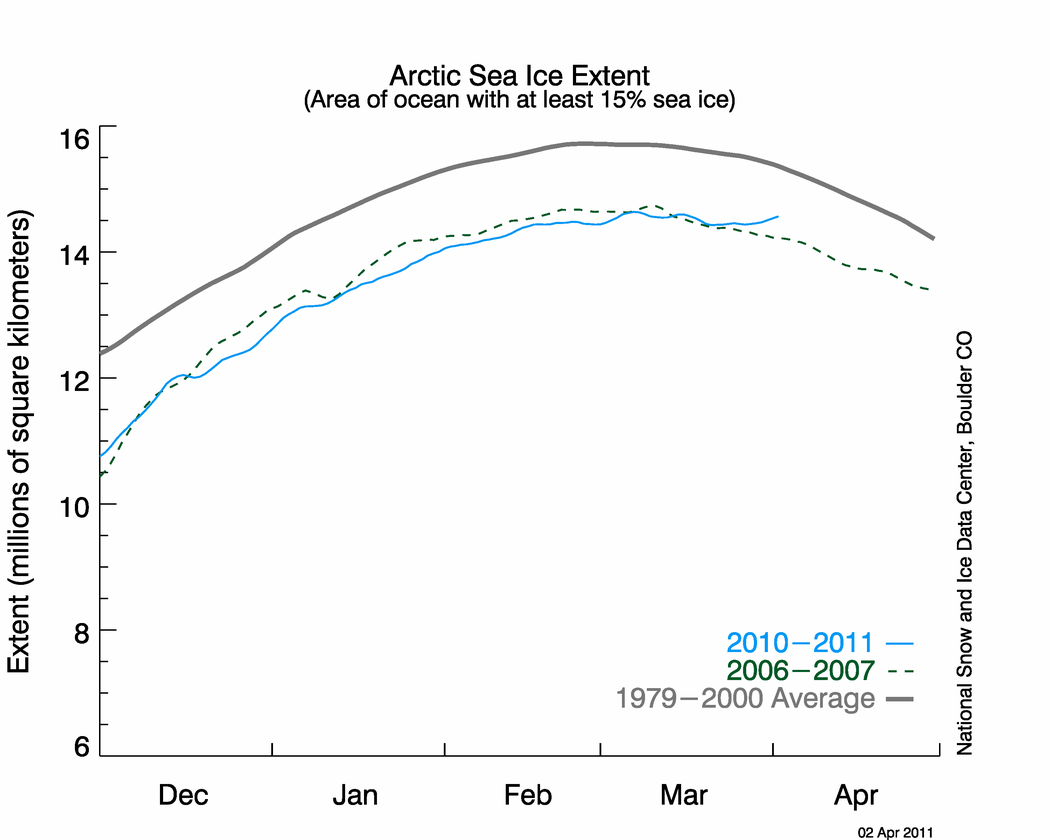
http://nsidc.org/data/seaice_index/images/daily_images/N_timeseries.png
Disrupting the Borg is expensive and time consuming!
Google Search
-
Recent Posts
- Gaslighting 1924
- “Why Do You Resist?”
- Climate Attribution Model
- Fact Checking NASA
- Fact Checking Grok
- Fact Checking The New York Times
- New Visitech Features
- Ice-Free Arctic By 2014
- Debt-Free US Treasury Forecast
- Analyzing Big City Crime (Part 2)
- Analyzing Big City Crime
- UK Migration Caused By Global Warming
- Climate Attribution In Greece
- “Brown: ’50 days to save world'”
- The Catastrophic Influence of Bovine Methane Emissions on Extraterrestrial Climate Patterns
- Posting On X
- Seventeen Years Of Fun
- The Importance Of Good Tools
- Temperature Shifts At Blue Hill, MA
- CO2²
- Time Of Observation Bias
- Climate Scamming For Profit
- Climate Scamming For Profit
- Back To The Future
- “records going back to 1961”
Recent Comments
- Bob G on Gaslighting 1924
- Bob G on Gaslighting 1924
- conrad ziefle on Gaslighting 1924
- Bob G on Gaslighting 1924
- Bob G on Gaslighting 1924
- arn on Gaslighting 1924
- conrad ziefle on Gaslighting 1924
- Gordon Vigurs on Gaslighting 1924
- conrad ziefle on Gaslighting 1924
- Robertvd on Gaslighting 1924


Whereas you have?
I invented the Internet
I’ll vouch for Steve.
I wonder why Al left out the info about the 2 week upsurge since the middle of March? Another bad sign (for him)?
Well NSIDC has not turned south yet ( or should that be North?? 🙂 ) still trending upwards.
JAXA shows no increase in the last few days, it is neither putting on ice or losing it currently, even so that is unusual. Colder weather on the Pacific and Atlantic side is stopping ice loss.
Andy
AndyW:
Ice loss is mainly due to wind conditions and currents pushing the ice OUT of the region.
The Arctic is having an erection. The warmists are screwed!
Quebec ice will determine the future of Western Civilization.
The ice rxtent is really well below the extent that it had when it created the Great Lakes.
Drawing a line on it in my graphics program still has it below the earlier maximum. It’s a pretty good optical illusion.
Additionally, I think we can all agree here that this upswing will have at most a small effect on the Sept min.
-Scott
NSIDC uses a five day lagging average, which means that the date of the graph probably was the peak for the year.