Texas fires probably due to global warming
“Here in West Texas, our rainfall’s getting more variable,” said Hayhoe, a specialist in modelling climate change across regions. “It’s either feast or famine. It’s either really dry or it’s really wet. We’re not getting a lot in the middle.”
Rainfall in a few heavy bursts rather than throughout a growing season might not help crops very much. Higher temperatures might boost irrigation demands, further depleting West Texas’ already declining Ogallala Aquifer, Hayhoe said.
Although no one drought or flood can be blamed on climate change, she said, the chances for such events might increase, like rolling dice loaded with an extra six.
“You never know if the six you roll is the natural one or the climate-change one,” Hayhoe said. “But you do know you’re getting them twice as much as you used to.”
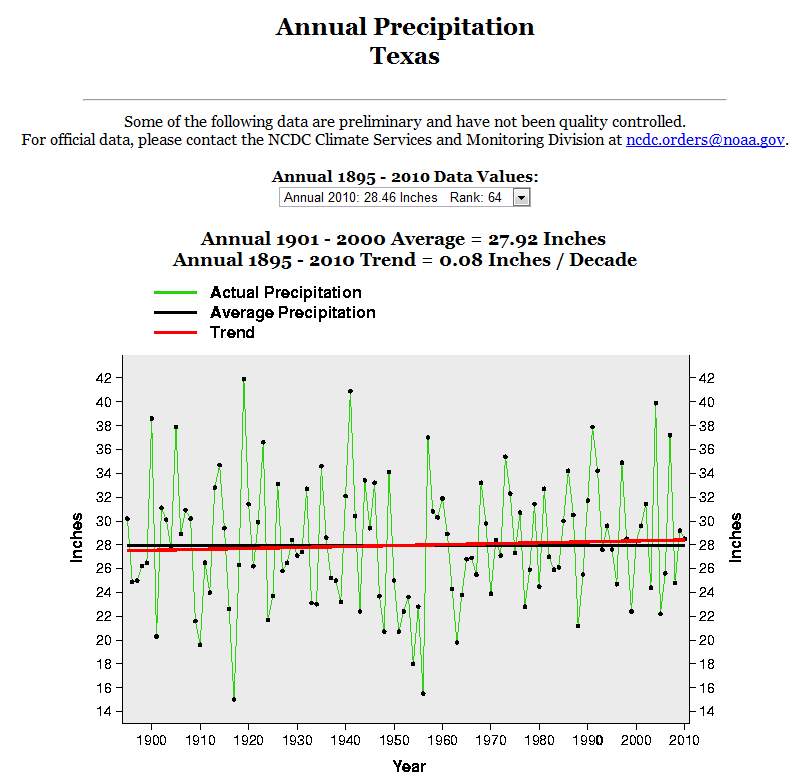
According to NCDC, rainfall in Texas is getting less variable. The lowest and highest years for Texas precipitation were both during the 1910s. During the 1950s, there were seven consecutive years with well below average precipitation.
http://www.ncdc.noaa.gov/oa/climate/research/cag3/tx.html
One thing we know for sure is that junk science drivel from scientists looking for recognition and funding is growing exponentially.


Where’s your data, Hayhoe?
Probably, could, might, may, possibly, are all little “escape hatches” just incase what was predicted doesn’t happen.
can we please show some residual respect for science by stopping calling climate modelers “scientists”?
Let’s call them Nintendo gamers. 🙂
Hi,
Just thought I’d drop in to clarify a few issues.
I do have a BSc in physics and a PhD in atmospheric science, if anyone is wondering where my credentials come from.
Regarding the information quoted above, I analyzed changes in the variance of observed *daily* data from NOAA/NCDC stations, no modelling of any kind involved. You are welcome to do the same and I would be happy to compare our results. Please note that the figure copied above is based on annual averages, not daily data, while my statement refers to changes in daily data for long-term stations with no more than 5% missing data over the period of record.
I appreciate any honest and civil critiques. Anonymous slurs are more insulting to the person making them than to the person on the receiving end.
Yours sincerely,
Katharine Hayhoe
Katharine,
Can you provide a link to the source data you used? Thanks in advance.
Katharine,
I can only echo Steve’s request for the link to your data sources. I’d be happy to give it a rudimentary look over. While I understand the distinction between daily observations and yearly averages, have you tried to reconcile the seeming contradiction? What was the time frame involved? Obviously, there are many more questions.
I have to say, I’ve lived in Texas off and on many times throughout my life. The rain there always struck me as extreme. Of course, it may be simply perspective and perception, but, from El Paso to S.A., it seemed like if there was a drop of rain there were flash floods.
At any rate, more information would be greatly appreciated. These news clips are often the only bit of information we have to compare with the figures at our reach. It lends to the appearance of shoddy scholarship when it could be we don’t have the same information available.
Thanks again,
James Sexton
The data I used is from the Global Historical Climatology Network. It is available here: http://www.ncdc.noaa.gov/oa/climate/ghcn-daily/
There isn’t any contradiction between having more variability at the day-to-day level but not seeing it at the annual level. For example: the average of (2,2,2) is 2, but the average of (0,0,6) is also 2. So if you have more dry days and more wet days, they can still average out to the same number over the year, but with very different consequences for farmers, homeowners, and even surface water supply, in the meantime.
Katharine,
Thanks!
http://stevengoddard.wordpress.com/2011/04/28/response-from-katharine-hayoe/
Yes, thank you Katherine. Most of us are aware of basic math principles. I’ll look at the data, while I agree, there is no explicit contradiction, is seems a bit off that the rainfall while being less extreme in the yearly variations are becoming more extreme in the daily.
Again, thanks for the clarification and data link.
James
whatever would link increases in daily variance and no change in annual variance in Texas to global warming? otherwise any change will do and science turn into a fishing expedition
A fishing expedition indeed. The link is a link to an endless amount of files and directories. I think we’re bogging down the site….. my navigation of the site is woefully slow. Steve, are you in there screwing up my surfing?
suyts says:
April 28, 2011 at 3:02 am
At any rate, more information would be greatly appreciated. These news clips are often the only bit of information we have to compare with the figures at our reach. It lends to the appearance of shoddy scholarship when it could be we don’t have the same information available.
Especially when bogus headlines are added to deliberately mislead!
Indeed, like this one? Texas fires push climate change hot buttons
The bogus one Steve added rather than use the one that was on the article.
Steve’s isn’t anymore bogus than the one used by the article.
Or:
Texas fires probably due to global warming