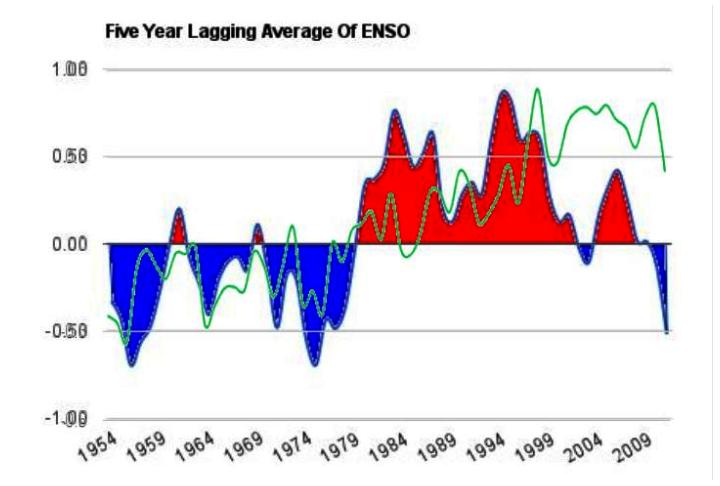
The graph above shows the five year lagging average of ENSO (blue/red) vs. HadCRUT yearly temperatures (green.)
ENSO turned strongly positive in the late 1970s, and temperatures started rising. ENSO dropped after the 1998 El Nino, and temperatures quit rising.
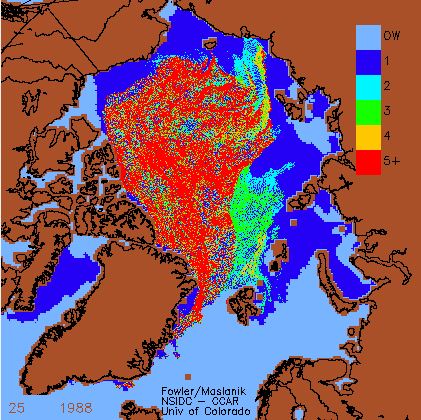
Also note that satellites began measuring ice, right when ENSO turned positive in the late 1970s. Most of the older ice was lost between 1988 and 1996, when ENSO was at its peak.

The vast majority of the 5+ year old ice blew out of the Arctic between 1988 and 1996.

1988

1996
http://nsidc.org/arcticseaicenews/2007.html
Isn’t it time to end this CO2 fairy tale?


How do you explain that UAH anomalies during the recent LA NINA are not that much different to the anomalies during the 1986/87 EL NINO, i.e.
Th world is as warm during the cool phase of ENSO as it was during the warm phase 20-odd years ago.
If you follow the graph, you see that warm lagged far behind the start of the warm phase…
When it flipped around 1979, it took two decades, 1999, for it to catch up.
Again, the spike around 2004, temps did not register that spike until 2009.
In spite of all the warming hysteria, it’s easier to cool the planet than warm it.
The flip to cool is followed closely.
Why did temperatures rise sharply between 1910 and 1940?
The temperature in the Arctic (in the sector to the NA) rose sharply due to a shift in the West Spitsbergen Current, which happened to commence in winter 1918/19. Thus the warming started in 1919 and not in 1910, as recently discussed in a post:
“Did the previous Arctic warming start in 1910 or in 1919?” at: http://diggingintheclay.wordpress.com/2010/11/20/did-the-previous-arctic-warming-start-in-1910-or-in-1919/
The story does not end there, but with a post titled:
Ocean structure change 1918/1919 at the Fram Strait.
Causation III – Did naval warfare contributed? Date 18 Dec.2010 at: http://www.2007seatraining.de/Archiv/dec1_10.html
dominated by El Nino events, just like 1970’s to now….
They don’t like to start their charts back any further.
If you start around 1700, you see the exact same slope we’re seeing now.
That hundred years, 1700-1800, could not have been caused by CO2.
If you consider that slope normal, subtract it from the slope we’re seeing now, CO2 has had no effect at all.
Is the ocean stupid to allow a small water pool in the equatorial pacific (called ENSO) to control the climate? It is an interesting, easy to recognise event, but it does not control climate. Climate is the blueprint of the ocean, the entire ocean, or should be understood it in this way: “CLIMATE is the continuation of the ocean by other means”, More at: http://www.whatisclimate.com/
Isn’t it time to end this CO2 fairy tale? Yes!
But it is also time to define CLIMATE in a scientifically reasonable manner!
It is abundantly clear from the graphs that ENSO drives global temperature and Arctic ice.
# “ENSO drives global temperature ”
RE: ENSO is the chicken or the egg?
Where is the ENSO in the case: Arctic warming 1919 to 1940 ?
Best regards AB
You tell me.
Si………..
Prof R. Piekle Sr: posted today (14 April 2011) “
„Climate Science Myths And Misconceptions – Post #2 On The Metric Of Global Warming”
http://pielkeclimatesci.wordpress.com/2011/04/14/climate-science-myths-and-misconceptions-%E2%80%93-post-2-on-the-metric-of-global-warming/
___with reference to ‘The Air Vent”: http://noconsensus.wordpress.com/2011/04/05/234-5/
R. Pielke says: Thus we can define that (extract):
___Global Warming is an increase in the heat (in Joules) contained within the climate system. The majority of this accumulation of heat occurs in the upper 700m of the oceans.
___Global Cooling is a decrease in the heat (in Joules) contained within the climate system. The majority of this accumulation of heat occurs in the upper 700m of the oceans.
Even over the ocean, the surface air temperature (marine air) is only a small part of this heat accumulation, and then only if it is well correlated with temperatures over at least a few meters of depth.
Prof. Pielke Sr. concludes:
“ Clearly, to use a single value (the global average annual average surface temperature trend) to characterize global warming is a naive approach and is misleading policymakers on the actual complexity of the climate system. “
“ Clearly, to use a single value (the global average annual average surface temperature trend) to characterize global warming is a naive approach and is misleading policymakers on the actual complexity of the climate system. “
Well said Roger Pielke. But it is the bleeding obvious.
Should we really be concerned if the rise in ‘global temperature’ is due to an increase in the minimum temperature in miserably frigid locations in the middle of winter.
Better start reading the fine print.