Disrupting the Borg is expensive and time consuming!
Google Search
-
Recent Posts
- Gaslighting 1924
- “Why Do You Resist?”
- Climate Attribution Model
- Fact Checking NASA
- Fact Checking Grok
- Fact Checking The New York Times
- New Visitech Features
- Ice-Free Arctic By 2014
- Debt-Free US Treasury Forecast
- Analyzing Big City Crime (Part 2)
- Analyzing Big City Crime
- UK Migration Caused By Global Warming
- Climate Attribution In Greece
- “Brown: ’50 days to save world'”
- The Catastrophic Influence of Bovine Methane Emissions on Extraterrestrial Climate Patterns
- Posting On X
- Seventeen Years Of Fun
- The Importance Of Good Tools
- Temperature Shifts At Blue Hill, MA
- CO2²
- Time Of Observation Bias
- Climate Scamming For Profit
- Climate Scamming For Profit
- Back To The Future
- “records going back to 1961”
Recent Comments
- conrad ziefle on Gaslighting 1924
- Bob G on Gaslighting 1924
- Bob G on Gaslighting 1924
- arn on Gaslighting 1924
- conrad ziefle on Gaslighting 1924
- Gordon Vigurs on Gaslighting 1924
- conrad ziefle on Gaslighting 1924
- Robertvd on Gaslighting 1924
- conrad ziefle on Gaslighting 1924
- arn on Gaslighting 1924


They are living in denial.
In 10 years time the above article might be referenced by skeptics just as “snowfalls are now just a thing of the past.”
Ya, there sure are human fingerprints all over it. Take a look at all them over the GISTemp adjustments.
Steve,
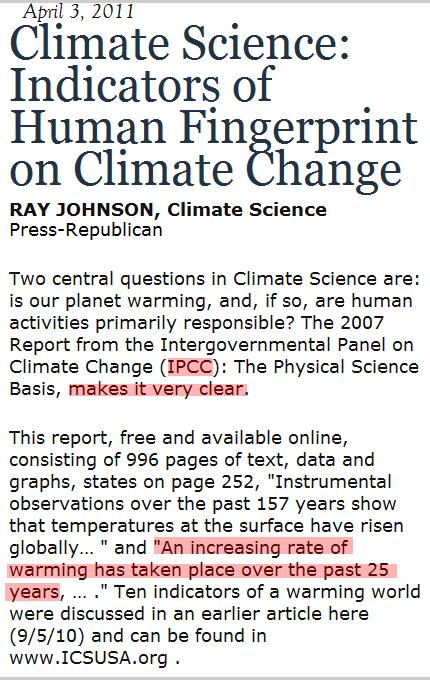
I may be wrong, but according to my (admittedly weak) math skills, 2001-2011 is not white 25 years.
I do love how you sometimes highlight the actual part of a link that limits the point of your posts, however.
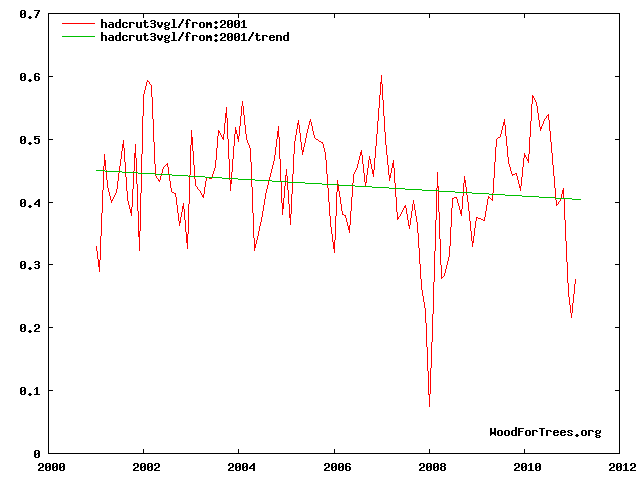
This is really complicated Tony. If the second half of a period has a negative slope, is the trend showing an “increasing rate of warming?”
Steve,
this is a newspaper article. If you want to show the slope from various measured sources from over the past 25 years you could do so.
If you want to only show information that supports your ideology, you can continue to only post information that reinforces that.
You could also point out that all sources show increased temperature change in the last 25 years, and question whether the last 10 might indicate that the rate is not in fact increasing.
On he other hand you could show that there are certain proxy records that actually show the temp has declined at an increasing rate over the last 25 years. There are many other options open to you as well
“increased temperature change”
Nonsense. That is the second derivative – which is clearly negative from the HadCRUT graph. You really have no idea what you are saying.