Disrupting the Borg is expensive and time consuming!
Google Search
-
Recent Posts
- Gaslighting 1924
- “Why Do You Resist?”
- Climate Attribution Model
- Fact Checking NASA
- Fact Checking Grok
- Fact Checking The New York Times
- New Visitech Features
- Ice-Free Arctic By 2014
- Debt-Free US Treasury Forecast
- Analyzing Big City Crime (Part 2)
- Analyzing Big City Crime
- UK Migration Caused By Global Warming
- Climate Attribution In Greece
- “Brown: ’50 days to save world'”
- The Catastrophic Influence of Bovine Methane Emissions on Extraterrestrial Climate Patterns
- Posting On X
- Seventeen Years Of Fun
- The Importance Of Good Tools
- Temperature Shifts At Blue Hill, MA
- CO2²
- Time Of Observation Bias
- Climate Scamming For Profit
- Climate Scamming For Profit
- Back To The Future
- “records going back to 1961”
Recent Comments
- Bob G on Gaslighting 1924
- Bob G on Gaslighting 1924
- arn on Gaslighting 1924
- conrad ziefle on Gaslighting 1924
- Gordon Vigurs on Gaslighting 1924
- conrad ziefle on Gaslighting 1924
- Robertvd on Gaslighting 1924
- conrad ziefle on Gaslighting 1924
- arn on Gaslighting 1924
- Gordon Vigurs on Gaslighting 1924
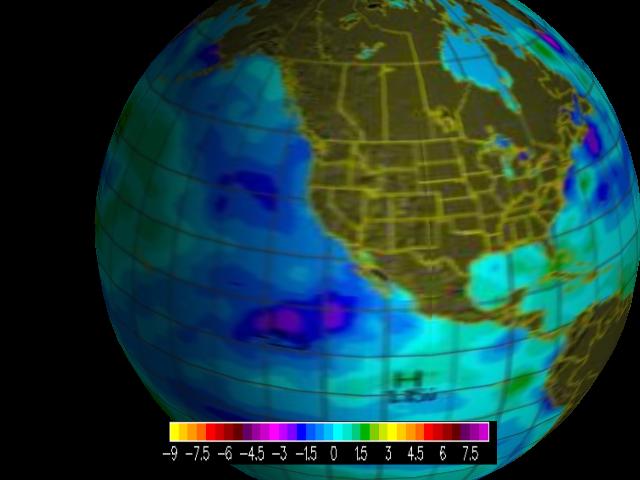
Missing Heat Found In The Oceans
This entry was posted in Uncategorized. Bookmark the permalink.


Something is not calibrated right….
It’s showing a positive anomaly around south Florida and the Keys.
Monitoring water temps is one of the things we do.
We have been below normal all year, and were below normal yesterday too.
Average 1.8 below for the month.
Did you remember to add the Hansenian factor?
I think the map was specifically for yesterday. How does that square with your observations?
we have 9 stations oceanside between the Dry Tortugas and Miami…
All 9 were below yesterday and have been below all year…..
We using probes, so they drift high.
If anything, our direct measurements will be higher, not lower.
Lol, then it is indeed, the Hansenian factor you forgot to add.
Seriously though, like most of these sites, it is almost impossible to find the data source. They mention observed temps and sat. data, but I can’t find what they use where. I’m guessing an extrapolating technique is involved.
ok, they’ve got something major screwed up here….
Go back to their SST for the middle of Feb.
They show a huge pool of cold water off the west coast of Fla.
Tampa area.
That pool of cold water is just now moving around us here.
There are three huge pools of shallow water down here, Florida Bay, Biscayne Bay, and the Everglades. But they only show that kind of heating in still air, the winds been out of the E at 15-20 all week.
It’s impossible for that to be the source right now.
I think the positive anomaly they are showing is some computer glitch, and instead of a + 3, it’s really a – 3.
-3 is right where our measurements are…..
Great. Now Trenberth can devote all of his time to more important things like making up stuff about hurricanes.
+3, -3, was it Steig or Mann who said sign wasn’t important? 🙂