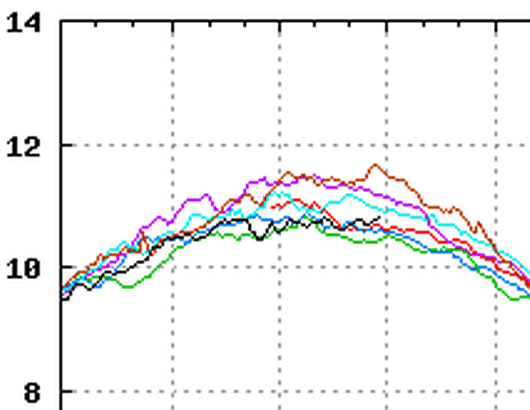
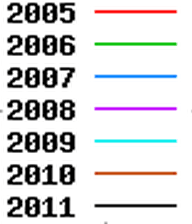
http://ocean.dmi.dk/arctic/icecover.uk.php
NSIDC told us on March 23 “Annual maximum ice extent reached” and “This year’s maximum tied for the lowest in the satellite record.”
In fact it is the latest maximum on record (indicating a cold spring) and ice extent is higher than 2005 and 2006 – the two years with the highest summer minimums in the DMI record.
Mark Serreze at NSIDC wrote in 2008 :
“As the climate warms, the summer melt season lengthens …”
Last year was the shortest melt season on record.

Looks like 2011 might be even shorter.


200 days from today is October 18, 2011.
We’ll see.
When does melting “starts”, exactly? What if we have a few more quasi-stationary days?
How do our warmist friends intend to spin this latest information? When they can’t spin information they usually just ignore it.
Just for fun?
Monthly Sea Ice Loss/Gain Numbers
April
2007 – Loss/Gain per day -9,894 = -306,719
2010 – Loss/Gain per day +13,402 = +415,469
2011 – Loss/Gain per day + 2,964 = + 91,875
May
2007 – Loss/Gain per day -27,521 = – 825,625
2010 – Loss/Gain per day -40,786 = -1,223,594
2011 – Loss/Gain per day ? = ?
We are doomed
And I thought Chelsea were playing quite well
Maybe Torres will score sometime
lol, that’s almost meaningful.
Joe,
I see you still like to use cherry picked data for very short time periods in order to push your biased political agenda on a subject that happens to fall well outside your particular area of expertise. You learned that lesson well from your buddy in crime, Joe D’Aleo.
All you need to do is actually look at a longer time record (isn’t that what climate is all about after all?):
http://earthobservatory.nasa.gov/IOTD/view.php?id=42456
Let’s get real, and stick with your actual expertise, weather forecasting, OK?
????
My last post was directed to Joe Bastardi who linked to your post :https://twitter.com/BigJoeBastardi
This forum is the only way I can respond to his ridiculous tweets.
By the way, the same comment I made to Joe B about cherry picking applies to your post as well.
Fantastic! One laments cherry picking whilst picking the whole 28-year satellite record as a long-enough time to look at for “climate”.
Congratulations!
i checked out the site you have and the data for days ends in 2007. However the article notes that the temp has gone down after that. Your link is not convincing of anything when it isn’t up to date. I have noticed as i have studied the issue and tried to decide who has the facts on their side that Those folks on the warming side frequently are quick to post charts that are out of date and end conveniently right before change in an opposite direction have occured. You help make the oppositions points.
Omnogist,
Actually I would consider a longer 28 year record more indicative of climate trend than placing such emphasis on a relatively small 5-year downward trend in an equally small 7 year record that Steve Goddard is trying to pass off as some sort of a climate trend.
If you consider the entire record of the data from the combination of both plots, the 31-year record (1979-2010) shows an the upward climate trend is still very much in play despite the relatively small 5-year downward trend in recent melt season length this post is trying to emphasize here.
In fact, you could say the 10-year downward trend from 1995-2005 was even longer and closer to a climate trend, but even that longer downward trend did not change the overall upward trend of the longer trend line.
Granted 31-years is not all that long in the relative passage of time since the earth was formed, but pushing a relatively insignificant 5-year trend does not add any more credibility to your (or Steve’s) side of the climate change argument.
Dennis, I think you’re missing the point. Steve’s merely pointing out the over eagerness for some to declare “ice max” and the errant assertions that come with it. Read what he’s stating.
As to your trends and years to make a trend (which no one brought up but you)……… I’ve read more articles this year alone about the melting icecap then I have fingers and toes. Its a game that gets played every year about this time. “ALL TIME RECORD LOW ARCTIC ICE!!!!!” Whether it be for a particular day of the year or lowest ice maximum. phht.
One can state with certainty, any article claiming a decrease in the arctic cap in the last 3 years is being very disingenuous. You’re not one of those are you? Claiming a decrease in the arctic ice while its increasing? That’s like someone babbling about global warming when the temps haven’t increased in over a decade.
31 or 28 years……. so what. The fact is, we started measuring the ice cap when it was at a high point in recorded history, as if that represents something that’s suppose to be there.
suyts,
The idea of a trend was implied when Steve quoted Mark Serreze:
“As the climate warms, the summer melt season lengthens …”
then smuggly replied: “Last year was the shortest melt season on record.” suggesting the trend is invalidated.
In regards to your comment about those that refer to articles about ice decreasing in the last three years, I am always looking at the longer term trends of a particular variable (as can be defined by all available data bases). In this case Steve showed an 8-year record from one availalbe data base just to make his point. My point is, why did he choose to ignore all other data bases with a longer record? Could it be that his point of this post wouldn’t be as strong (or actually negated) if he did so.
To your other point: “Claiming a decrease in the arctic ice while its increasing?”
Isn’t that what Steve just did, only in reverse?
To your point that the ice record began at the peak of the ice cap (1979?), you also have to look at the bigger picture of the global temperature trend that happens to be longer than the ice record that shows we have been in an increase for the past 100+ years:
http://www.woodfortrees.org/graph/hadcrut3gl/from:1850/offset:0.39/mean:12/plot/gistemp/from:1850/offset:0.3/mean:12/plot/uah/from:1970/offset:0.54/mean:12/plot/rss/from:1970/offset:0.54/mean:12
Wouldn’t your peak in the ice cap (1979?) have to occur at the same time there was at or near a minimum in the temperature record to be true? Logic would suggest that that the more likely peak ice cap occurred around 1850 and not 1979. Would your argument still be the same if the ice record started in 1850?
Finally, if you can find and show me any long-term historical record (of raw climate data) where there has never been a brief short-term decrease in the long term trend of that variable, then I would be interested in seeing this straight line effect you are suggesting. I don’t think anyone has ever suggested that global warming eliminates short-term (small wave) cycles in the data. For you to suggest so would also be disingenuous.
Even during the development of the super-greenhouse Cretaceous Period, I believe that there were probably many short-term periods where temperatures would have swung in the opposite directions. But those short-term swings never changed the fact that the earth was in a warming trend leading up to that super-greenhouse.
Climate is of course linear rather than cyclical. That is why the entire earth is covered with ice.
So Steve,
You do agree that there are indeed short-term cycles that may briefly counter a longer term trend?!! Any comment you can as to the signficance of these relatively small short term blips of trend reversal other than providing you with a positioned reason for a blog posting of inconsequencial meaning relating to the longer term global climate change debate?
Dennis, the current 10,000 year plus interglacial is a short-term blip on the longer term trend.
In fact it is the latest maximum on record (indicating a cold spring) and ice extent is higher than 2005 and 2006 – the two years with the highest summer minimums in the DMI record.
Steve, going by that graph, it looks like 2011 is greater (or about equal) to 2006 & 2007. The 2005 extent looks greater than 2011. Am I misinterpreting the graph?
Greg.