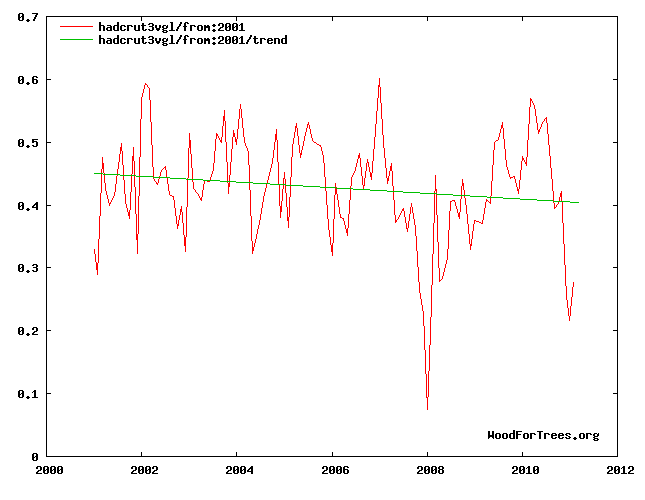
They asked Muller the wrong questions. Warming is miniscule, and the little warming we have seen isn’t primarily due to CO2.
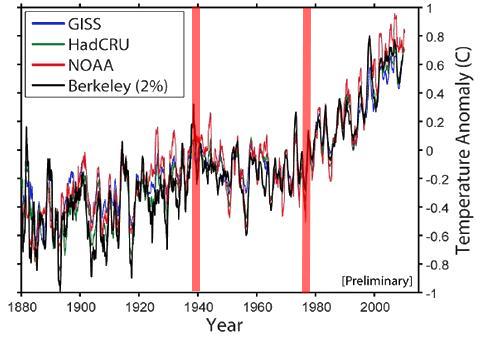
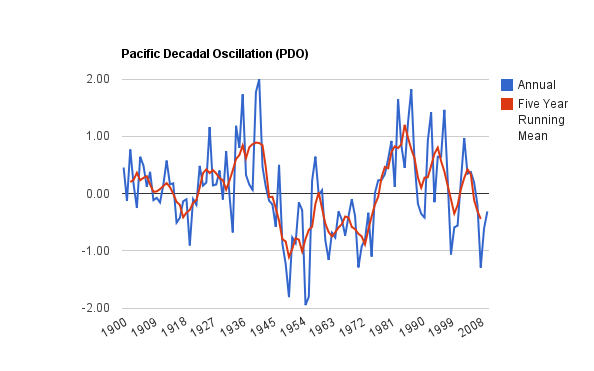
Muller’s graph shows very clearly the effect of the PDO on the “global temperature.” Around 1940 and 1977, PDO polarity reversed. Warming is associated with a positive PDO. The PDO is now negative and there has been no warming over the last decade.
http://jisao.washington.edu/pdo/PDO.latest


Perhaps I have lived too long in the UK, but these Parliamentary reviews seem extremely pointless. Politics will triumph, not debating ability, evidence, science, or “truth”.
Believe me, the world will turn no matter what the US Congress deliberates.
I question all the data on the top graph. They make it like it was warmer in the 1970’s that it was during the pre-1940 period. It was far colder and snowier in the 1970’s than it was say in the 1920’s. Also makes it look like there has been consistent rapid warming since 1980 to present, with maybe an insignificant leveling off for the past few years. All of the plots would appear to have a warm bias and look dangerous for the future.
agreed. It has the same fancy footwork that diminished the 1930’s that Reverend Hansen uses.
So…. the planet warms while PDO is +ve and stays flat while PDO is -ve. The net result is a steady upward ratcheting of global temperature.
What’s causing that rise, Steven?
Wahoo – 0.7C in 150 years. Below scenario C.
perfectly normal climate oscillations…
It’s supposed to work this way, and all life on this planet evolved to work with it…
…otherwise none of us would be here
Temperatures go up, metabolisms go up, demand for CO2 goes up, and CO2 follows the rise in temperature…
…that’s the way it works
The planet fluxes between optimums and minimums..
..that’s what drives evolution
and all life on this planet evolved around that
The same thing that caused the rise from 1900 to 1940.
“and stays flat while PDO is -ve”
Do you honestly have any confidence, Peter, when we compare temperatures from the 1930’s with now that we are actually comparing like for like?
UHI, land use changes, changing methods for measuring sea temps and many other factors can affect temps by much more than the small changes actually recorded. And this is even before adjustments are made.
We do know that there were indications of a colder climate leading upto the 70’s including increasing levels of arctic ice.
There is therefore no hard evidence that climate now is significantly warmer than 70 years ago.
We had thermometers that accurately measured to 1/100th of a degree in the 30’s………..
the readers were drunk on their butts though
We all broke the dam.
Steve Goddard wrote, “Muller’s graph shows very clearly the effect of the PDO on the ‘global temperature.’”
What you’re seeing is the AMO, not the PDO. The PDO does not represent the Sea Surface Temperature of the North Pacific. In fact, the Sea Surface Temperature of the North Pacific (north of 20N) is inversely related to the PDO, so what you are proposing is impossible, Steven.
http://i52.tinypic.com/ipaxjr.jpg
Discussed in this post:
http://bobtisdale.wordpress.com/2010/09/14/an-inverse-relationship-between-the-pdo-and-north-pacific-sst-anomaly-residuals/
And for those who are interested in what the PDO represents, and, more importantly, what it does not represent, refer to:
http://bobtisdale.blogspot.com/2010/09/introduction-to-enso-amo-and-pdo-part-3.html
Bob, Please read this :
http://stevengoddard.wordpress.com/2010/10/30/relationship-between-pdo-and-enso/
Steven: The PDO is an aftereffect of ENSO. It’s the domination of El Nino events over a time period that causes the positive PDO, so your description in the linked post is backwards. The PDO is also impacted by Sea Level Pressure, which is why it has slightly different timescales.
?? I haven’t made any claim of cause or cause and effect.
stevengoddard says: “?? I haven’t made any claim of cause or cause and effect.”
But in the post you wrote, “Muller’s graph shows very clearly the effect of the PDO on the ‘global temperature.’”
The PDO clearly does affect the global temperature. I was not making any claim of cause and effect between PDO and ENSO.
stevengoddard says: “The PDO clearly does affect the global temperature. I was not making any claim of cause and effect between PDO and ENSO.”
Please explain the processes that accomplish this.
Two things to keep in mind: First, the PDO, in effect, only represents the spatial pattern of the North Pacific SST anomalies, not the SST anomalies themselves. A rise in the PDO can mean that the western and central North Pacific SST anomalies dropped, while the eastern North Pacific SST anomalies remained the same. In that instance, global temperatures would have dropped while the PDO rose.
And second, don’t forget that the SST anomalies of the North Pacific north of 20N (the area used for the PDO) is inversely related to the PDO.
I’m not (and rarely do) making any attempt to discuss theory. This blog is about empirical observations.
Steve Goddard says: “I’m not (and rarely do) making any attempt to discuss theory. This blog is about empirical observations.”
And what I’ve presented to you illustrates and discusses why your empirical observations are incorrect on this matter.
It’s a common mistake. Many people incorrectly believe the PDO data is similar to the AMO and that the PDO represents the SST anomalies of North Pacific.
I showed a relationship between PDO and global temperature. Do you believe that relationship does not exist?
Bob, it seems you and Steven are having a conversation about 2 different things and you’re letting semantics get in the way of the thinking.
Look at your graph you presented, http://i52.tinypic.com/ipaxjr.jpg .
Now look at the graph Steve presented. http://stevengoddard.files.wordpress.com/2011/04/chart_11.png
Maybe this graphic is better to present.
http://jisao.washington.edu/pdo/
Clearly a positive PDO warms some places and cools others as does a negative PDO. As far as explaining why this happens, ………… does it matter?
suyts: The graphic from JISAO that you linked gives the wrong impression of what the PDO represents. The PDO data only addresses the area north of 20N, nothing more.
http://i39.tinypic.com/262prfa.jpg
The PDO data has nothing to do with the tropical Pacific or the South Pacific.
The map I linked shows the PDO in the “Cool” mode, according to NOAA, but notice that the SST anomalies for most of the North Pacific north of 20N have elevated SST anomalies.
The PDO does not have the effect on global temperatures that Steve represents. I’ve presented this in numerous posts:
http://bobtisdale.wordpress.com/2009/04/27/misunderstandings-about-the-pdo-%e2%80%93-revised/
And for those reading this thread who want an introduction the the PDO:
http://bobtisdale.wordpress.com/2010/09/03/an-introduction-to-enso-amo-and-pdo-part-3/
Bob, thanks, but again, I think you’re letting semantics get in the way here. I’ve read much of your writings in regard to the oscillations of our oceans. And I agree with them.
But here, you seem to be implying that it isn’t relative in any way to the SST’s of the pacific or anything else for that matter. I rather think that’s a narrow view you’re presenting here. The PDO operates in a vacuum?
Damn….. Multi-link moderation! I’ll try it this way.
Bob, you’re letting semantics ruin the conversation and get in the way of the thinking. One of your other pages carries the graphic that better illustrates the PDO than simply describing it as northern pacific SSTs.
http://jisao.washington.edu/pdo/pdo_warm_cool3.jpg
As to the “why”, does it matter?
Bob
My no doubt simplistic understanding of PDO is that a positive PDO is marked by an above average incidence of El Nino and a negative by La Nina.
Surely therefore a positive PDO would see a rise in global temperatures?
The paper by Bratcher + Giese seems to suggest the same with the following summary:-
“An analysis of ocean surface temperature records show that low frequency changes of tropical Pacific temperature lead global surface air temperature changes by about 4 years. Anomalies of tropical Pacific surface temperature are in turn preceded by subsurface temperature anomalies in the southern tropical Pacific by approximately 7 years. The results suggest that much of the decade to decade variations in global air temperature may be attributed to tropical Pacific decadal variability. The results also suggest that subsurface temperature anomalies in the southern tropical Pacific can be used as a predictor for decadal variations of global surface air temperature. Since the southern tropical Pacific temperature shows a distinct cooling over the last 8 years, the possibility exists that the warming trend in global surface air temperature observed since the late 1970’s may soon weaken. “
Paul H: The quote you provided by Bratcher + Giese discusses the tropical Pacific, not the North Pacific north of 20N, which is the area from which the PDO is calculated.
I have no doubt the tropical Pacific can and does drive global temperatures and that there are multidecadal variations in the strength and frequency of ENSO events, which impact the rises and falls in global temperatures on those timescales, but the point I’m trying to make on this thread is that global temperatures are not driven by the PDO. As I’ve illustrated and discussed in the posts I’ve linked above, the PDO is, in effect, an aftereffect of ENSO.
Regards
Thanks Bob.
I think you refer to these as Pacific Decadal Variations.
I suppose the real issue is what causes these multi-decadal variations and whether we are now entering the cool phase.
suyts says: “But here, you seem to be implying that it isn’t relative in any way to the SST’s of the pacific or anything else for that matter. I rather think that’s a narrow view you’re presenting here. The PDO operates in a vacuum?”
You’re missing the points of my comments and the posts. There are multidecadal variations in the North Pacific SST anomalies. If we detrend North Pacific SST anomalies, we can see that the variations are similar to the AMO. They run in and out of phase with the AMO:
http://i56.tinypic.com/t9zhua.jpg
But those detrended SST anomalies of the North Pacific are not represented by the PDO:
http://i56.tinypic.com/a31b2c.jpg
The PDO is an abstract expression of the North Pacific SST anomalies and, in and of itself, the PDO has no impact on global temperature. Let’s expand on the example I provided for Steve to illustrate this.
A rise in the PDO can mean that the western and central North Pacific SST anomalies dropped, while the eastern North Pacific SST anomalies remained the same. In that instance, North Pacific and global temperatures would have dropped while the PDO rose. Or a rise in the PDO could mean the eastern North Pacific rose, while the central and western North Pacific SST anomalies remained the same. In that case, a rise in the PDO occurred during a rise in the SST anomalies of the North Pacific and globe. In one case, global temperatures fell, and in the other, global temperatures rose, both with a rise in the PDO.
stevengoddard says: “I showed a relationship between PDO and global temperature. Do you believe that relationship does not exist?”
Yes. I believe the relationship does NOT exist, and I’ve explained why numerous times on this thread. The PDO does NOT represent the Sea Surface Temperature of the North Pacific. The PDO is an abstract form of those SST anomalies.