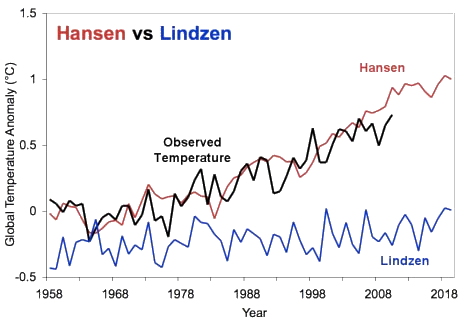
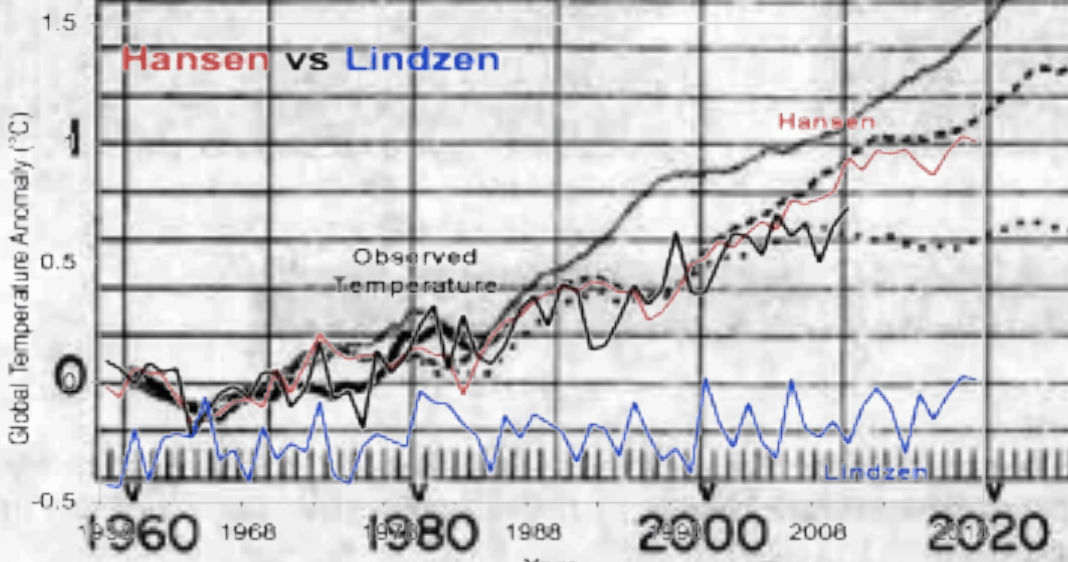
Cook published this graph purporting to show that Hansen is better than Lindzen at forecasting temperatures. There are so many things wrong with this graph, it is difficult to know where to start.
1. Hansen made three forecasts, Cook picked scenario “B” which Hansen described as “a reduced linear linear growth of trace gases.” Obviously that has not happened and is not the correct one. He should be comparing against scenario A. Joe Romm says that greenhouse gases have been “accelerating super-exponentially.”
2. He used Hansen’s temperature data to verify Hansen’s predictions. That is like trusting Al Gore’s lawyers to count ballots in Florida.
3. Cook offset Lindzen’s start point downwards by half a degree. Obviously the data needs to be normalized before comparing.
4. He drew scenario B below Hansen’s actual scenario B. Note the red line above is too low.
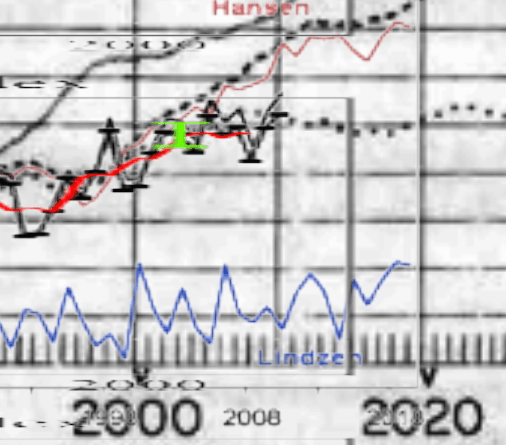
5. He drew Hansen’s measured data too high. The thick red line below and horizontal bars are from the GISS web site. The black line above it is what Cook drew. Hansen reported 0.63 for 2010, Cook placed it above 0.7
In summary, he used the wrong projection, he let Hansen officiate, he didn’t normalize Lindzen’s data, and he misplaced both the projection and the results on the graph.
Reader Chilli adds :
Another deception is that Cook just made up the “Lindzen graph”. It does not represent any prediction ever made by Lindzen. Cook made the bogus graph by simply removing CO2 from Hansen’s temperature model. Naturally this produced a flat line since Hansen’s failed model is programmed to only respond to CO2.
The flat line merely shows how the model fails to account for natural effects of sun and ocean cycles – effects which Lindzen acknowledges and Cook does not.
So bravo to Cook for setting up and knocking down a strawman using an entirely circular argument.


Very interesting!
Doctor KH. Care to empirically analyze this?
Another deception is that Cook just made up the “Lindzen graph”. It does not represent any prediction ever made by Lindzen. Cook made the bogus graph by simply removing CO2 from Hansen’s temperature model. Naturally this produced a flat line since Hansen’s failed model is programmed to only respond to CO2.
The flat line merely shows how the model fails to account for natural effects of sun and ocean cycles – effects which Lindzen acknowledges and Cook does not.
So bravo to Cook for setting up and knocking down a strawman using an entirely circular argument.
Steve,
you have pointed this all out to Mr. Cook?
I see no comment from you, but I assume that is because he is scared of what you wrote and will refuse to publish it.
I just read the column and the comments and will do so for you!
No need to thank me.
I’m sure he will hear about it soon.
lol, Tony, you think the alarmists don’t know what’s being stated here and other places?
Cook often relies on cherry picked data and other “tricks” like steve points out in order to “juice up” his position. I laugh when Cook is brought up because it forces my memory to relive the time I saw his picture at Revkin’s blog and spewed coffee all over my keyboard.
http://dotearth.blogs.nytimes.com/2010/03/24/a-physics-mavens-take-on-skeptical-science/
I also laugh because when no real climate scientists could be drafted for the “climate quick response team”, leaving only a tiny cadre of finger waving post-normal activist semi-scientists who never respond, the end of days warmistas were crushed and then by default annointed Cook, a religious loon who feels he’s on a mission from God, to carry their water. The irony of the anti-religious warmista crowd, relying on a religious zealot who thinks he is doing God’s bidding, is just too rich in irony to not laugh at.
OMG I shouldn’t have clicked on that link while eating lunch.
OMG as well .. holy crap!
Cook:
Meanwhile the drones at SS high 5 each other congratulating John Cook for doing the first and only honest assessment of Hansen’s predictions.
This has been gone over at CA many times. It’s like the spaghetti graph purportedly supporting Mann’s hockey stick. No matter how many times the zombie is killed, it keeps coming back to life.
Steve,
“Greenland is not losing hundreds of billion of tonnes of ice every year because someone placed a thermometer near an air conditioner.”
From here – what do you make of this?
I saw that. I’ve explained the problems with GRACE to Cook many times, but he just keeps repeating the same crap.
You can lead a horse to water………. .