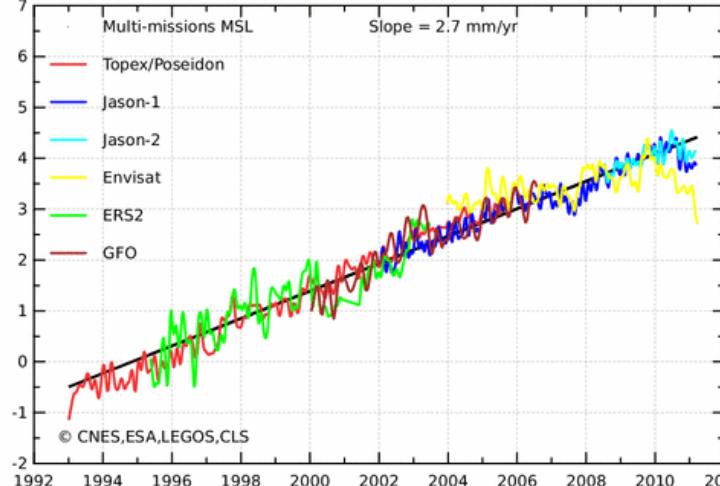
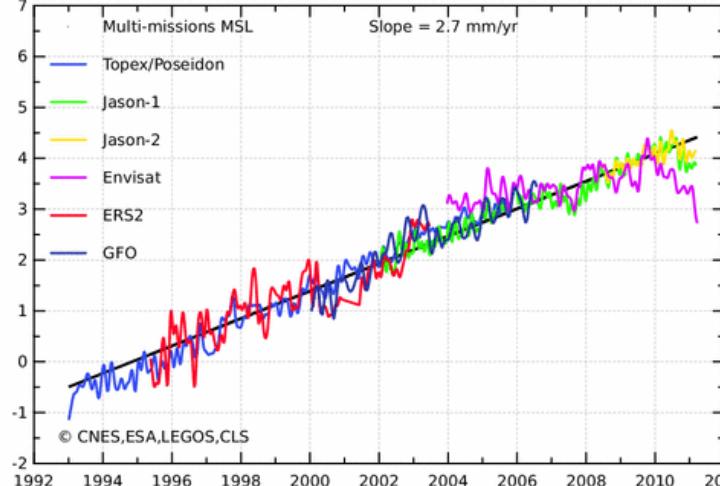
There are only six colors, which is why aviso chose to paint Envisat an almost invisible yellow on their sea level graph. The simply didn’t have any choice.
http://www.aviso.oceanobs.com/
I however have access to more recent computer technology (after 1970) which permits more than six colors and actually allows you to see the falling sea level data from Envisat.
I can’t imagine why they tried to make Envisat almost invisible.


Global warming scientist predicted the earth would have both a rise in sea level and an increase in precipitation from all the melting ice. The increased precipitation was supposed to be in the form of rain in lower latitudes and snow in higher. But sea level is dropping. Snow is falling in flower latitudes.
How many predictions by global warming scientists have to fail before global warming believers stop believing?
lower latitudes, not flower latitudes
No, stick with “flower latitudes”, it’s vivid and poetic, the latitudes wherein flowers.
We’re told that it would hardly snow
wherein the pretty blossoms grow;
their catastrophic attitudes
would ruin flower latitudes,
but though they say the seas will rise
the evidence before our eyes
is that sea-levels don’t upswing
and flowers yet will brighten spring.
… wherein flowers grow.
How many predictions by
global warming scientistsHarold Camping have to fail beforeglobal warmingreligious believers stop believing?All they had to do was use a darker yellow, orange, black, gray, purple, or brown. Even the cheapest plotting software has that, LOL.
-Scott
The next time they’ll use white. 🙂
I thought that too!
-Scott
No can do, that is the color of racists.
Hi Steve,
Thanks so much for posting this. I had not seen the data by separate satellite. I was just fishing around on the web to better understand the satellites and how they differ.
There are some wiki sites for each satellite. Jason-1 was launched in 2001, Envisat in 2002, and Jason-2 in 2008.
Jason-1 and Jason-2 seem to have similar measurements with the hint of an uptick in 2011, but Envisat clearly is dropping.
I would be interested in anything you might have on the differences between the satellites. Thanks again for the graph.
Best regards,
Don
Jason averages are dominated by some regions east of the Philippines with very high numbers (10mm/year), but their stated error in those regions is almost as large as the numbers. In other words, the Jason data is almost meaningless.
The Jason satellites use a metal tape measure that is subject to temperature changes affecting the measurements and Evisat uses the more modern cloth tape measure that is not affected by temperature changes. Metal shrinks in cold weather and expands in warm weather.
Thanks for your thoughts.
Don
Back in the days of using ComputerVision Personal CADD design software, a black background was the default and always made the most sense to me ever since because it alone seems to highlight all the other colors the best – especially yellow. (
Something like this, (it would have been better if I had had the original GIF…) – http://i2.photobucket.com/albums/y48/mikeishere/animationimage1943.gif