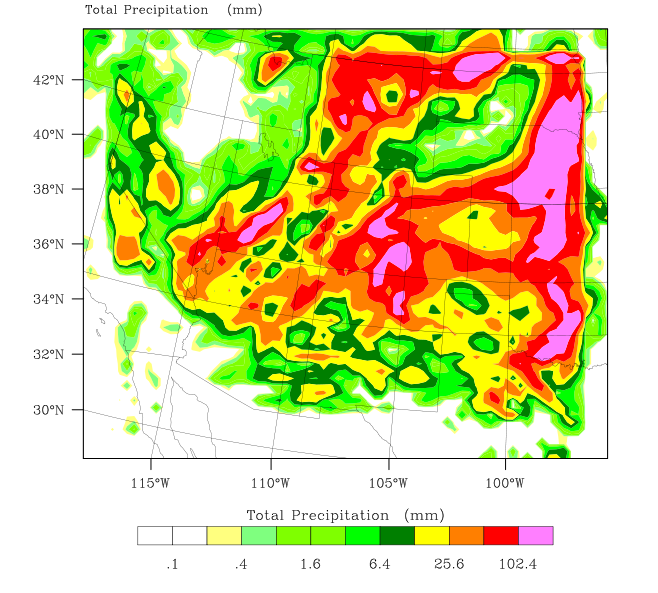
Over the last two days we have had January high temperatures in Colorado, and about 10% of our normal annual precipitation has fallen in the last 36 hours. A few days ago I ran a four day GFS/WRF (NCAR) weather simulation (above) which did an excellent job of predicting the patterns and quantity of rain.
The mountains must be getting tons of additional snow. Here is the view from Glacier Basin Campground In Rocky Mountain National Park


The snow season is not over yet, with more unseasonably cold, wet weather out west yet to come next week.
Steve:
didn’t you have an article with UAH and GISS maps of March temperature anomalies yesterday? I believe that UAH map showed a much “bluer” picture of the Arctic than the much “redder” or warmer GISS map?
I sent that in an e-mail to a friend who is an AGW believer without scritinizing the sources well. I believe that the GISS site shows the anomaly between a different range of dates than the UAH site. If so, it wouldn’t be a valid conclusion to say that GISS data is garbage (or misleading). I was called out on that. Now, I cannot find your post anymore. Did you delete it because of the same reason (realizing the comparison was not valid)?
I’d appreciate a feedback because the credibility of our sides arguments are weakened if the AGW crowd can say we are misleading (the same thing we accuse them of). Thanks a bunch. Keep up the good work.
The only article I ever deleted was one about Britney Spears and global warming which someone claimed they had IP for.
http://stevengoddard.wordpress.com/2011/05/11/just-how-bad-is-giss/
The GISS data is labeled anomaly vs 1951 to 1980.
Does that mean that their map is different than the UAH map (comparing different periods maybe?)
Are they comparing the same anomalies (between same periods)?
Excuse my ignorance but I’d appreciate a simple explanation so that I can defend our position (of GISS data being misleading). UAH map does not indicate “anomaly vs. some date or range of dates).
Thanks again.
GISS uses a different baseline than UAH, cherrypicked because it was cold. That doesn’t account for much of the discrepancy though. GISS has no stations on the ice sheet or at high elevation – which is the vast majority of Greenland. The ice sheet had the largest negative anomalies, and GISS has no data there.
They do have one station with a long-term contiguous record in Greenland, but it is suspect. http://stevengoddard.wordpress.com/2011/05/12/giss-danmarkshavn/