Disrupting the Borg is expensive and time consuming!
Google Search
-
Recent Posts
- Gaslighting 1924
- “Why Do You Resist?”
- Climate Attribution Model
- Fact Checking NASA
- Fact Checking Grok
- Fact Checking The New York Times
- New Visitech Features
- Ice-Free Arctic By 2014
- Debt-Free US Treasury Forecast
- Analyzing Big City Crime (Part 2)
- Analyzing Big City Crime
- UK Migration Caused By Global Warming
- Climate Attribution In Greece
- “Brown: ’50 days to save world'”
- The Catastrophic Influence of Bovine Methane Emissions on Extraterrestrial Climate Patterns
- Posting On X
- Seventeen Years Of Fun
- The Importance Of Good Tools
- Temperature Shifts At Blue Hill, MA
- CO2²
- Time Of Observation Bias
- Climate Scamming For Profit
- Climate Scamming For Profit
- Back To The Future
- “records going back to 1961”
Recent Comments
- Bob G on Gaslighting 1924
- John Francis on “Why Do You Resist?”
- conrad ziefle on Gaslighting 1924
- Bob G on Gaslighting 1924
- Bob G on Gaslighting 1924
- Bob G on Gaslighting 1924
- conrad ziefle on Gaslighting 1924
- Bob G on Gaslighting 1924
- Bob G on Gaslighting 1924
- arn on Gaslighting 1924
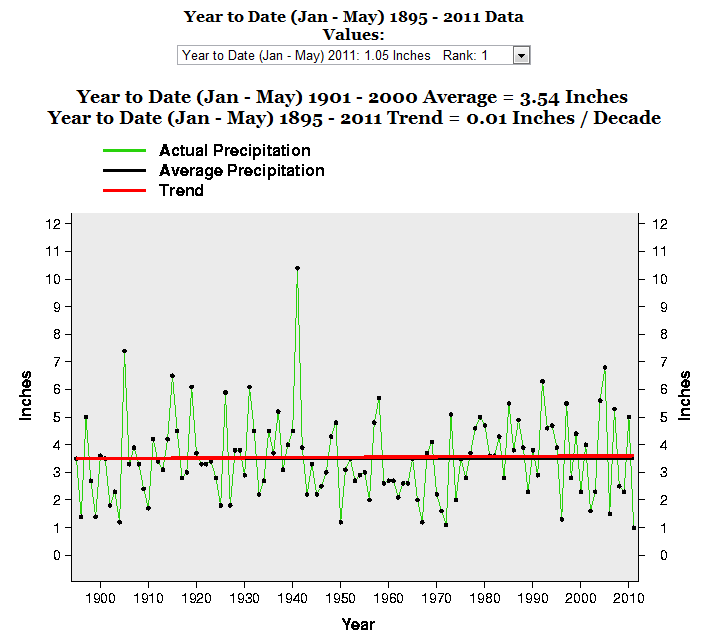
Driest Year On Record In New Mexico
This entry was posted in Uncategorized. Bookmark the permalink.


“Driest Year On Record In New Mexico”……… so far.
Doesn’t look like that much of an outlier to me. Not to mention that the overall trend is (insignificantly) up. Long-term trends only matter when the CAGW believers say they matter.
-Scott
There is not nothing.
Someplace will always be record hot, record cold, record wet, record dry. Like other records, weather records are meant to be broken.
Not much discernible difference from 1973… Is one of those “hottest year evah” things where the difference is something like 0.01?
..and why did you graph only year-to-date figures? The trend for annual rainfall is: +0.13 Inches / Decade
OT
Apology from Chris Wallace about “Are you a flake?”
http://www.youtube.com/watch?v=vHMcq5_tDE8
Good for him for doing so … too many people these days would try to rationalize it or explain it away.
His masturbatory life is exposed. He’s a masochist. He created this “issue,” purposely. His face is falling off. He wanted to juice her, wanted somehow to say “help me mommy,” but merely ended up in a rut. He has no game, now he must eat crow, in shame. Why did he ask a hate question anyway? Psychologists call it “active depression.”
Taken over the last 12 months it looks pretty normal to me.
http://climvis.ncdc.noaa.gov/cgi-bin/cag3/hr-display3.pl