Disrupting the Borg is expensive and time consuming!
Google Search
-
Recent Posts
- Gaslighting 1924
- “Why Do You Resist?”
- Climate Attribution Model
- Fact Checking NASA
- Fact Checking Grok
- Fact Checking The New York Times
- New Visitech Features
- Ice-Free Arctic By 2014
- Debt-Free US Treasury Forecast
- Analyzing Big City Crime (Part 2)
- Analyzing Big City Crime
- UK Migration Caused By Global Warming
- Climate Attribution In Greece
- “Brown: ’50 days to save world'”
- The Catastrophic Influence of Bovine Methane Emissions on Extraterrestrial Climate Patterns
- Posting On X
- Seventeen Years Of Fun
- The Importance Of Good Tools
- Temperature Shifts At Blue Hill, MA
- CO2²
- Time Of Observation Bias
- Climate Scamming For Profit
- Climate Scamming For Profit
- Back To The Future
- “records going back to 1961”
Recent Comments
- Bob G on Gaslighting 1924
- Bob G on Gaslighting 1924
- arn on Gaslighting 1924
- conrad ziefle on Gaslighting 1924
- Gordon Vigurs on Gaslighting 1924
- conrad ziefle on Gaslighting 1924
- Robertvd on Gaslighting 1924
- conrad ziefle on Gaslighting 1924
- arn on Gaslighting 1924
- Gordon Vigurs on Gaslighting 1924
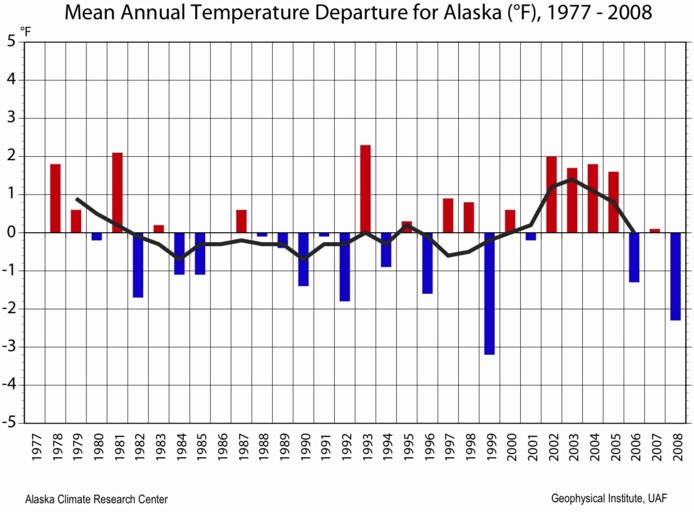
Temperatures In Alaska Plummeting Since 2002
This entry was posted in Uncategorized. Bookmark the permalink.


There are too many blue bars on that thing……..
…I’ll stay right here on this rock out in the ocean thank you
Anywhere but there……. north side of hell as far as I’m concerned. I can’t imagine ’99. I was there for the blue bars of 88-92.
That said, isn’t it interesting how Steve has found all of these step changes starting in and around 2002.
Again, you insist on cherry picking. Any first grader knows that weather did not exist before 1979 (due to unreliable data before satellites) nor has it existed since 1998 (due to jet stream disruption and global wierding).
What happened to all that warm weather Alaskans enjoyed three decades ago? Is this related to North Carolina sinking?
YES!!!!
You could see the Russian heat from there.
;O)
Thank you Steve for keeping up with all the warmist drivel, I don’t have the time or energy but enjoy the condensed version that you provide.
Wow, that’s great, a graph from March 2009. Do you have one with 2009, 2010 and 2011 as well?
2011 would be a stretch due to mean annual temperature departure.
From the Alaska Climate Research Center [1949 – 2009]
As you can see the recent warming trend is over.
Thanks, Jimbo, that graph is already much more complete than the one above.
Be careful about the likes of Barrow as well Jimbo.
Population there has increased from about 300 in 1970 to about 5000 now. Research suggests that there is now significant UHI effect there of maybe 2C in winter.
http://www.geography.uc.edu/~kenhinke/uhi/HinkelEA-IJOC-03.pdf
Gee … Alaska exhibits 30 year cycles of cooling and warming corresponding with the PDO. The warming ended in 2008 when the PDO switched to its negative phase. Who would have thunk it? 🙂
No, I don’t work at the University of Alaska.