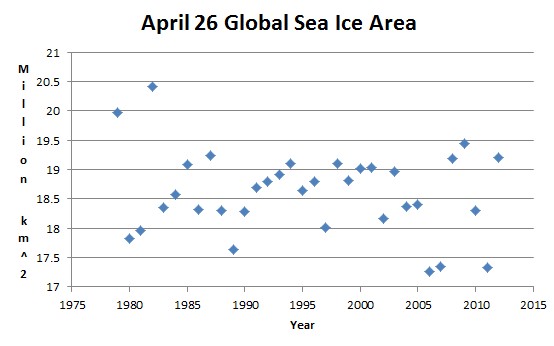
The only recent years with more ice than 2012 were 1982, 1979, 2009 and 1987.
Climate experts tell us that global warming causes massive sea ice loss at both poles, in the form of a “death spiral.” They also say that skeptics are “breathtakingly ignorant” about sea ice.
arctic.atmos.uiuc.edu/cryosphere/timeseries.global.anom.1979-2008


Poster child is under threat…they will just move the goal posts….
An interesting article in the Independent… and they’re not allowing comments. I wonder why not?
http://www.independent.co.uk/environment/climate-change/exclusive-scientists-warn-that-there-may-be-no-ice-at-north-pole-this-summer-855406.html
That article is from 2008
D’OH!
No real trend.
“No real trend” means NO GLOBAL WARMING!
Aw SHUCKS! 2012 really screws-up that ‘wonderful & impressive’ rapidly-declining trend that had developed over 2009-2011 and that was all the rage with the shallow-press…..last year!!!
Has this made the NYTimes yet to make it ‘official’?
Isn’t it wonderful to have this perspective provided by REAL HISTORICAL DATA!
Now what about that epidemic of drowning Polar Bears due to lack of Arctic ice? Are we going to have to ship Polar Bears to Antarctica, and see how they like a diet of penguins?
And like ice-area data, how long and ACCURATE is our historical record on the Polar Bear population? Next we’ll need a satellite capable of counting Polar Bears to keep NASA busy!
Given the data, if global warming skeptics are breathtakingly ignorant, the conclusion must be that liberals are breathtakingly BRAIN DEAD!
Oh yes, we are so ignorant. They should attack the tinfoil conspiracy theorists. Now, those idiots are idiots.
This is completely random!
you have plotted the data of ONE day. Would you be honest enough to plot the data for the min. ice extent (e.g. Sep. 15th) ??
You must be an exceedingly smart person if you know what the September 15th value is. Do you have a Ouija board?
That made my morning! 🙂
You must be a Climate Scientist, if you don’t know what the word Random means. The modifier Completely completes the picture.
Steven:
Wordpress keeps kicking me out and my last comment disappeared. I still like your answer. Maybe R C does not realize that September 15th has not happened yet this year. 😉
stark: I meant the post is complete random, as in ‘urban dictionary’ not as in ‘stat’
Steven: I’ve created it from the same dataset. It took me 10 min. and I can send you the plot, which shows quite an impressive decline. I wish it could say something about me being smart ….
and Mike: Yes, the plot starts in Sep 15 1979 and ends in Sep. 15 2011 ………
.
Do you know what Sept 15 2012 ice extent is?
The point is that one day’s data is meaningless. Try this, from NSIDC:
http://nsidc.org/images/arcticseaicenews/20110906_Figure3.png
The current data is meaningless?
Some guy called Hansen does…
Hansen measurements – Normalizing the Unbelievable(c) with the NASA seal of approval.