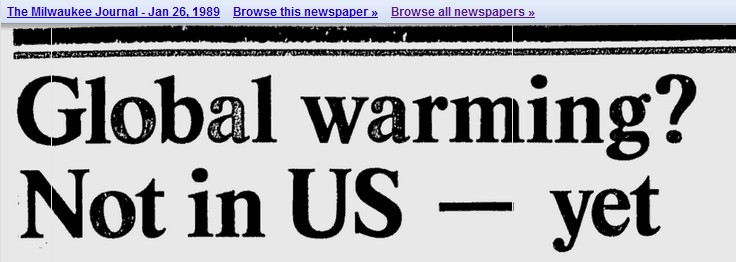
The Milwaukee Journal – Google News Archive Search
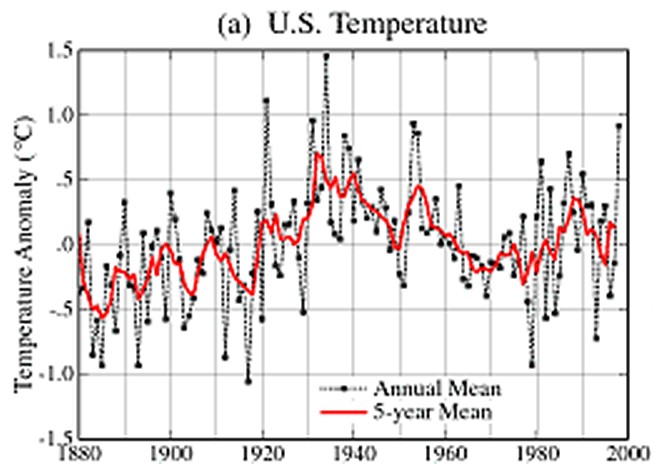
In 1989, the experts concluded that the US was not warming. Hansen’s 1999 graph agreed with that assessment.
Phil Jones also agreed that the US was not warming.
February 04, 1989
Last week, scientists from the United States Commerce Department’s National Oceanic and Atmospheric Administration said that a study of temperature readings for the contiguous 48 states over the last century showed there had been no significant change in average temperature over that period.
Dr. (Phil) Jones said in a telephone interview today that his own results for the 48 states agreed with those findings.
Global Warmth In ’88 Is Found To Set a Record – New York Times
Hansen wrote in 1999 that the climate had improved since the 1930s.
Empirical evidence does not lend much support to the notion that climate is headed precipitately toward more extreme heat and drought. The drought of 1999 covered a smaller area than the 1988 drought, when the Mississippi almost dried up. And 1988 was a temporary inconvenience as compared with repeated droughts during the 1930s “Dust Bowl” that caused an exodus from the prairies, as chronicled in Steinbeck’s Grapes of Wrath.
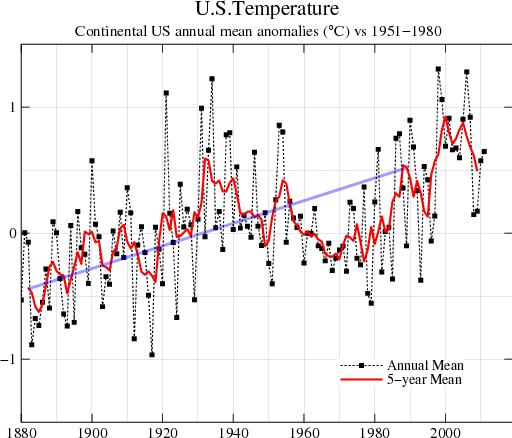
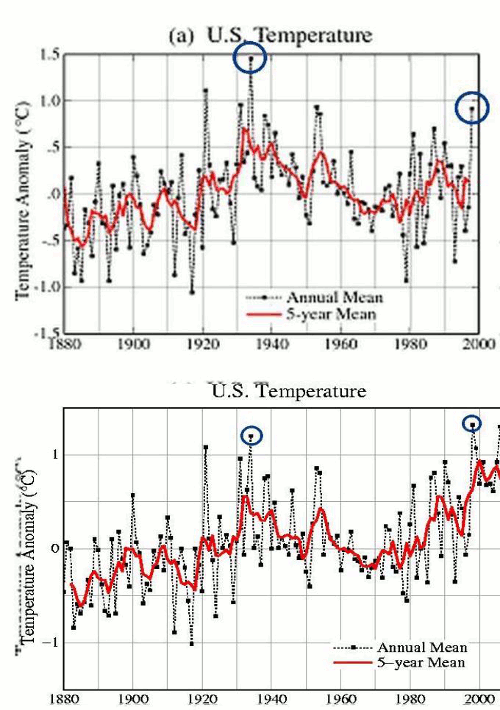
No warming means no funding and no massive ego trip, so Hansen fixed the temperature record in the year 2000 to produce a lot of US warming prior to 1989.
The blink comparator below shows how Hansen rewrote US history.


If an employee in a large government institution allow this to happen, I can see no other explanation than that it is sanctioned by the government.
A shame really. It destroys people’s trust in the government.
This isn’t exactly new news. The differences between graphs are alluded to here: http://data.giss.nasa.gov/gistemp/
99.99% of people who see the GISS graphs believe that they are seeing raw data. Prior to 2000, all the experts agreed that the US wasn’t warming.
The fact that a couple of global warming activists went and adjusted the data upwards is very important information.
NOAA says March 2012 was 0.5F warmer than March, 1910 – but the March 2012 data was adjusted upwards by 0.6F. This is also important information which is being intentionally obfuscated.
Hansen gave more detailed analysis here: http://pubs.giss.nasa.gov/docs/2010/2010_Hansen_etal.pdf
I am well aware of his analysis. I am also aware of his tendency towards confirmation bias, and the responsibility of scientists to continually publish the raw data.
Well of course he invented an explanation for whatever he did. How believable would his con be otherwise? Duh.
Hansen really had nothing to do with the changes. They were made by NOAA back in 2000. NOAA created a new data set to account for changes station moves, instrumental changes, procedural changes, etc. A description of these changes has been posted on the web for about 12 years:
http://www.ncdc.noaa.gov/oa/climate/research/ushcn/ushcn.html
http://www.ncdc.noaa.gov/img/climate/research/ushcn/mean2.5X3.5_pg.gif
http://www.ncdc.noaa.gov/img/climate/research/ushcn/ts.ushcn_anom25_diffs_pg.gif
Hansen is not responsible for the data he publishes? Fascinating.
Steven,
I’m sure Hansen stands behind what he publishes. My point was that you and others were pointing the finger at him personally for changing the data, and it wasn’t him or his office. They are users of the data provided by NOAA.
Hansen changed his published data in the year 2000. No doubt it was really the doing of little global warming elves over at NOAA.
I thought I might find intelligent discussion here. Guess not. Bye.