
The Arctic’s rapidly shrinking sea ice cover:
a research synthesis
Julienne C. Stroeve ·Mark C. Serreze ·
Marika M. Holland · Jennifer E. Kay ·
James Malanik ·Andrew P. Barrett
Received: 15 February 2011 / Accepted: 22 April 2011
© The Author(s) 2011. This article is published with open access at Springerlink.com1 Introduction
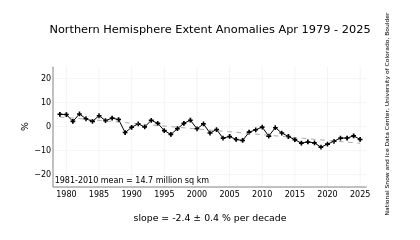
Arctic sea ice extent over the modern satellite record (1979–present) shows downward trends in all months, smallest in winter and largest at the end of the summerwww.arcus.org/files/projects/supplemental/674/stroeve_etal_seaice_synthesis_2011.pdf
The modern satellite record for the Arctic began in 1971, not 1979. Nimbus satellites showed a sharp increase in ice extent from 1974 to 1979. which NSIDC doesn’t like to discuss because it would completely mess up their linear graph below.
")
Below is the incline which NSIDC is hiding. From the 1990 IPCC report.

www.ipcc.ch/ipccreports/far/wg_I/ipcc_far_wg_I_full_report.pdf

I’m not sure why the record would have started in 1971, since there weren’t any Nimbus launches that year. They even have data from Nimbus 2 which was launched in 1966.
I seem to recall that we had very thick ice up in Eureka that winter/spring. I have a photo of the auger extensions i used to drill down to measure the thickness…and from our station records one of the thickest years recorded…
The 1979 start date is the very definition of cherry picking.
No, its the very definition of lying.
no it’s the start of the multi-channel passive microwave record. Steve knows that ESMR was a single channel passive microwave sensor and it does not extend to the time that SMMR was launched. So if you want a record from 1972-present, you have to fill in the gap with other data. The ‘modern’ satellite data record does indeed begin in October 1978 (or for September from 1979 to present).
Steve is also aware that there are other satellite observations that extend to the early 1960s. Most of this is visible imagery, which is also useful for getting information on where the ice is as long as it’s not cloudy. Then there are ship observations, aircraft observations, etc. that can allow one to go back to 1953 somewhat reliably. Steve could show that data, but he selectively chooses not to since it would invalidate the point he hopes to make.
Dr. Stroeve,
The data sources are not identical, but there was enough detailed satellite data available in the 1970s to make accurate comparisons, which the IPCC did in their 1990 report. NSIDC should include the pre-1979 information on their graphs.
Here is a comparison I just did comparing end of April NSIDC 2012 vs. National Ice Center end of April 1974.
http://stevengoddard.wordpress.com/2012/04/29/arctic-ice-area-about-the-same-as-1974/
The first four Nimbus satellites had only visible and IR optical instruments, which couldn’t see through clouds.
Nimbus-5:
http://nsidc.org/data/docs/daac/nsidc0077_esmr_tbs.gd.html says Nimbus-5’s ESMR (passive microwave) instrument provided sea-ice extent data from 11 December 1972 through 16 May 1977.
(http://nsidc.org/data/nsidc-0009.html says data only exists from 12 December 1972 through 31 December 1976, but their web site nevertheless has data through 11 May 1977.)
Nimbus-6:
http://nssdc.gsfc.nasa.gov/nmc/datasetDisplay.do?id=ESAD-00066 says Nimbus-6’s ESMR provided data from 17 June 1975 to 10 August 1977, but the data has apparently been lost. (!!!)
Seasat-1:
Launched 27 June 1978, and failed 10 October 1978. It carried a duplicate of the Nimbus-7 SMMR, but apparently most of its data has also been lost. (!!!)
http://southport.jpl.nasa.gov/scienceapps/seasat.html
Note that its short data record must have included SRRM measurements of the 1978 Arctic sea-ice minimum.
Nimbus-7:
http://nssdc.gsfc.nasa.gov/nmc/experimentDisplay.do?id=1978-098A-08
Launched 24 October 1978, it’s SMMR provided data through August 1987.
Comparisons between the earlier ESMR data and the later SMMR data would be more reliable if there’d been some overlap between them, and it’s a rotten shame the government has apparently lost so much of the old data. But the 4-1/2 years of Nimbus-5 data surely has some value, and I agree with Steven that it should not just be ignored.
Were there any other early satellites which were doing sea-ice measurements?
s/ SRRM / SMMR /
I posted this on a different thread, should have posted here since it is about the 1973 chart.
OK, here is my attempt. You will have clicked on different spots than I did, but this is the data I extracted using EnGauge (a chart digitizer) :
http://www.divshare.com/download/17540955-39b
Download the sea ice excel sheet…
Looks reasonably close. Need a better original to have a better result.
http://digitizer.sourceforge.net/