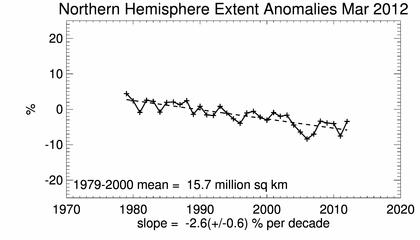
NSIDC tells us that the satellite era began in 1979, and they show extent declining steadily during that period.
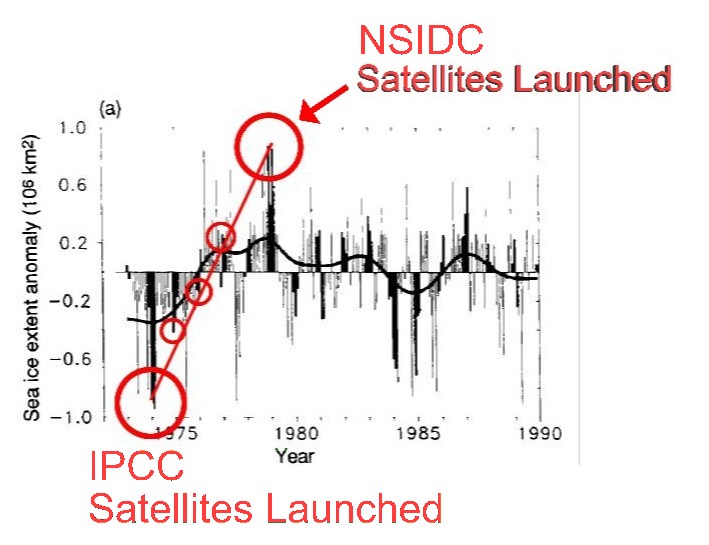
This is fascinating, because the 1990 IPCC report told us that the satellite era began in 1972, and that ice extent was much lower in 1974 than in 1979.
www.ipcc.ch/ipccreports/far/wg_I/ipcc_far_wg_I_full_report.pdf
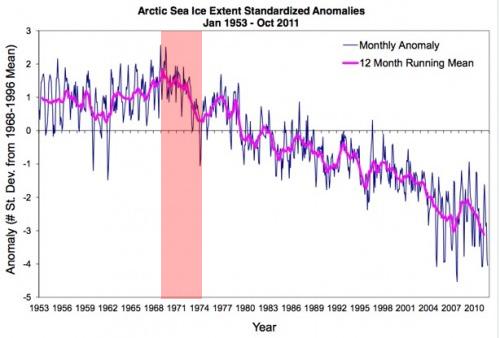
NSIDC has been hiding the incline, but what about the period before 1974? The widely published graph below shows a sharp drop in ice extent from 1969 to 1974.
I Can Engage In A Flawed Debate About Climate Change
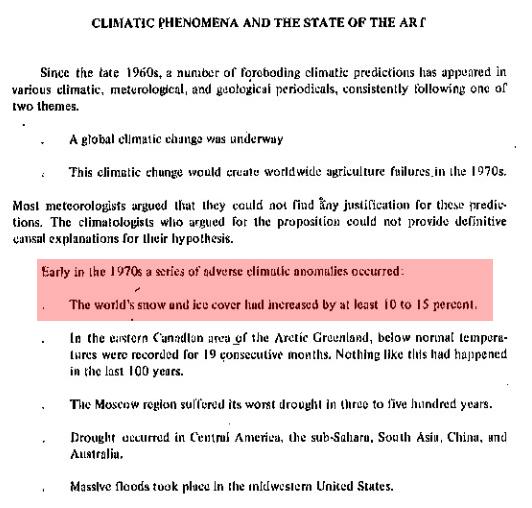
This is also fascinating, because the people who were paying attention at the time saw the exact opposite.
When Climatologist George J. Kukla of Columbia University’s Lamont-Doherty Geological Observatory and his wife Helena analyzed satellite weather data for the Northern Hemisphere, they found that the area of the ice and snow cover had suddenly increased by 12% in 1971 and the increase has persisted ever since. Areas of Baffin Island in the Canadian Arctic, for example, were once totally free of any snow in summer; now they are covered year round.
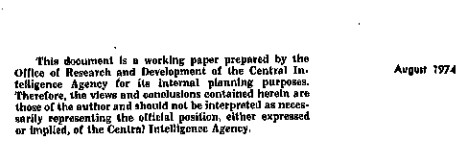
The CIA reported the same phenomenon.
In 1952, experts reported that the Arctic was melting at an astonishing rate
CLEVELAND, Feb. 16 (A.A.P.) Dr. William S. Carlson, an Arctic expert, said to-night that the Polar icecaps were melting at an astonishing and unexplained rate and were threatening to swamp seaports by raising the ocean levels.
18 Feb 1952 – POLAR ICE THAW INCREASING GLACIERS SAID TO [?] M…
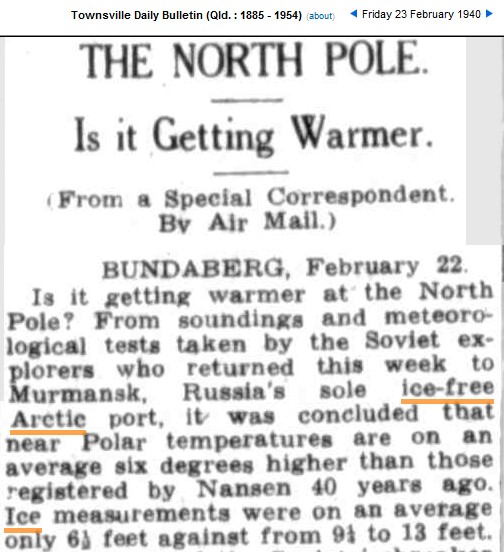
But what about ice thickness? In 1940, Russians reported that the average ice thickness had been reduced to 6.5 feet – about the same as it is today.
23 Feb 1940 – THE NORTH POLE. Is it Getting Warmer. | BUNDABER…
The historical record tells us that nothing unusual is happening in the Arctic, which is why alarmists are working hard to rewrite it.



excellent post………………
It would appear that the modern Little Ice Age from 1960-1979 was for real and has been largely neglected by so-called climate experts. It is hard to excuse their selective amnesia, since many of them lived thru those severe winters. Waterloo, Iowa’s top three coldest Januaries in well over 100 years were 1977, 1978 and 1979. David Ludlum, noted climate historian has stated that those 3 consecutive extreme winters were “unprecedented” in American history, since the days of colonization. Unlike the fakers, he was not one to throw that word around lightly.
Thanks, Steve for once again pointing this out. Hiding the 1930’s heat and the 1960-1979 cold have been key factors in this scam.
Reblogged this on TULUGAQ and commented:
Issittup oqaluttuarisaanera allaqqillugu
Ole:
That is easy for you to say! 😉
It means Issittup (Of The Arctic) oqaluttuarisaanera (The History) allaqqillugu (Rewriting) Funny language we have §.-)
😉
Steve, do you know of anywhere that has that original Satellite data in the IPCC graph?
I found this
http://nsidc.org/monthlyhighlights/2010/01/techno-archaeology-rescues-climate-data-from-early-satellites/
And this
http://cires.colorado.edu/science/spheres/snow-ice/historic-data.html
But no actual data.
And this
http://www.geospatialworld.net/index.php?option=com_content&view=article&id=21284%3Aold-satellite-data-to-reveal-cause-of-arctic-ice-thinning&catid=53%3Aapplication-natural-hazard-management&Itemid=1
Still no actual data
Even Wiki talks about “Useful satellite data concerning sea ice began in December 1972 with the Electrically Scanning Microwave Radiometer (ESMR) instrument.”
With all the improvements over the years in observation equipment and evaluation methods none of the data is useful for comparison from one period to the next. It is probably not even as valid as anecdotal accounts.