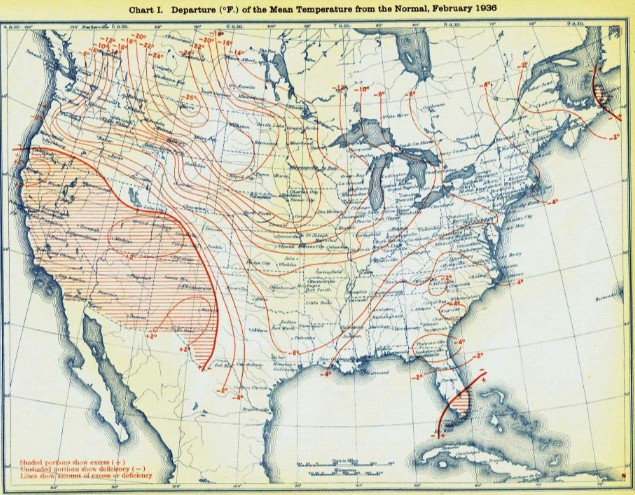
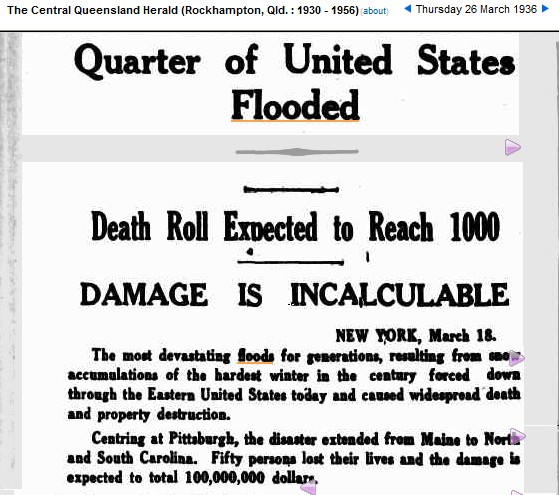
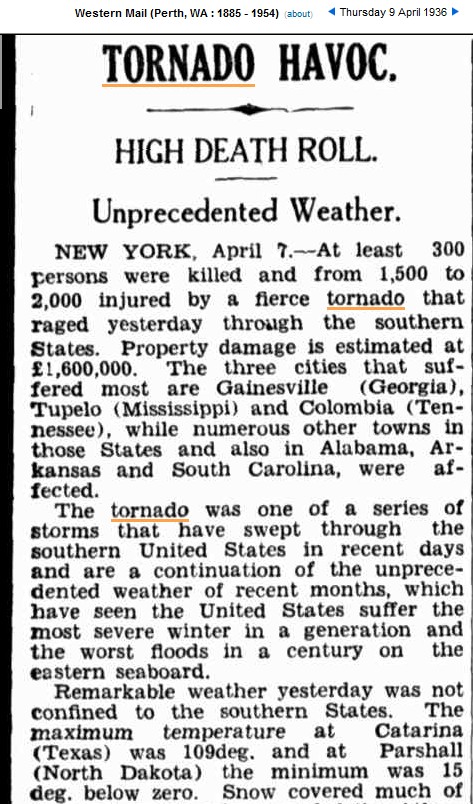
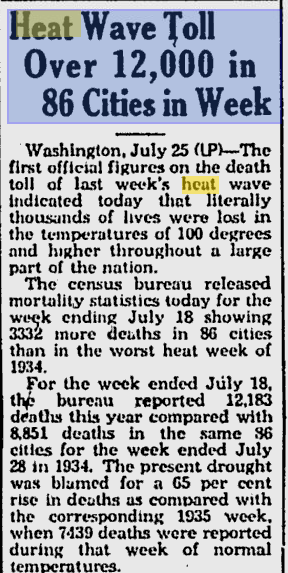
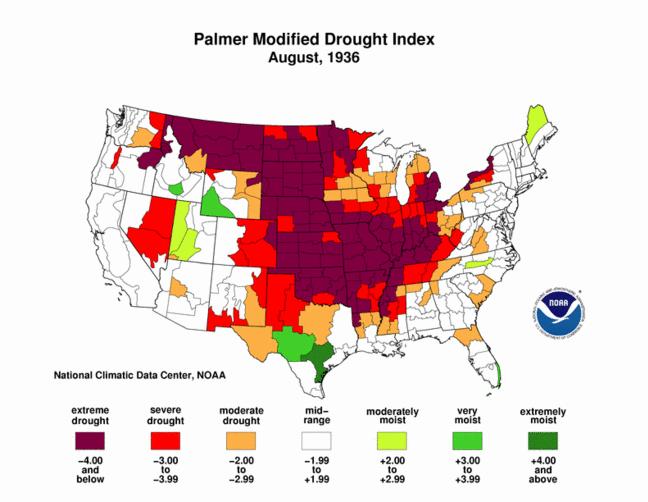
February, 1936 was the coldest month in US history. March saw severe flooding. April brought catastrophic tornadoes, July was the hottest month in US history, and August brought near-record drought – only exceeded by 1934.
“Experts” who claim that severe weather has increased, are simply incompetent.
docs.lib.noaa.gov/rescue/mwr/064/mwr-064-02-c1.pdf
26 Mar 1936 – Quarter of United States Flooded Death Roll Emot…
09 Apr 1936 – TORNADO HAVOC. HIGH DEATH ROLL. Unprecedented We…
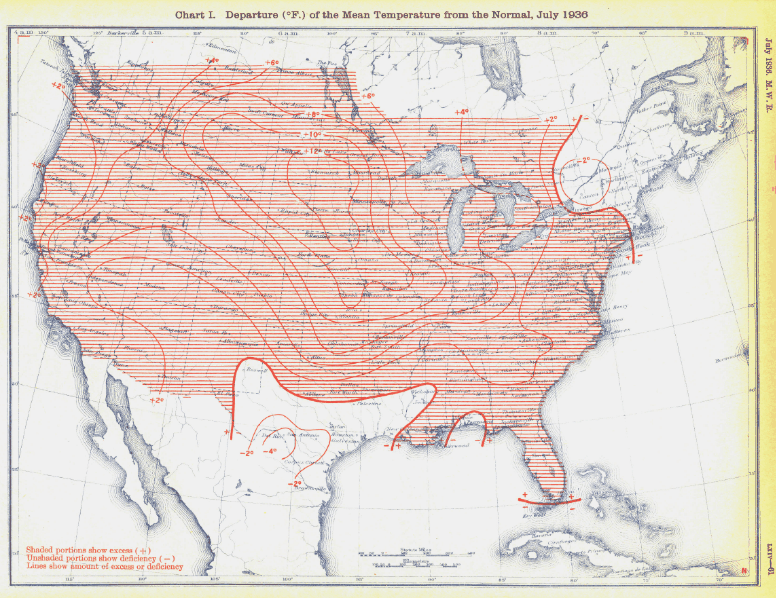
http://docs.lib.noaa.gov/rescue/mwr/064/mwr-064-07-c1.pdf



I prefer the term: Lying Commie Scum
How long before historical PDI records are ‘adjusted’ down the memory hole?
The article forgot the mention the tornadoes of April 1936, where 400+ were killed across the South during two consecutive days.
Thanks for the tip Andy.
NY Times: Clouds last hope of deniers. Makes Lindzen look like a lone wolf on cloud issue.
http://www.nytimes.com/2012/05/01/science/earth/clouds-effect-on-climate-change-is-last-bastion-for-dissenters.html?src=me&ref=general
The long-term CEI plot: http://www.ncdc.noaa.gov/extremes/cei/graph/cei/04-09 (note the binomial fit line and how it has increased)
tells a much different story than the one you (and Joe Bastardi) are trying to spin here.
Gosh golly darn Dennis, you don’t think the massive increase in detection capability over the last 30 years might have anything to do with the shape of that graph?
http://www.ncdc.noaa.gov/oa/climate/severeweather/tornadoes.html
We didn’t until recently have hundreds of storm chasers in largely uninhabited areas, with their cameras riveted, ready to record any tiny whirlwind swirling some trash around. Nor did everyone in the public carry a camera a few years back as they do now. That is obviously going to increase the number of detected tornaodes.
Gosh darn Steven,
You don’t think the high death tolls you are obviously trying to point to were due to the fact that forecasts and warning of such disasters were not too good back then either do you?
Yes, they could have evacuated the US and saved those 12,000 people from dying in the heat.
Steven,
Maybe it is because they had no air conditioning back then either or places for the elderly to take shelter like they do now!
Gosh golly darn Dennis, I am sure that you made the same argument about the Moscow heatwave two years ago, where they have no air conditioning.
No,
Maybe it was because that heat wave broke 130-year heat records (you know even before than in 1936 – gasp):
http://www.accuweather.com/en/weather-blogs/andrews/russia-heat-wave-statitistics-staggers-the-imagination/34969
July, 1936 was the hottest month in US history. CO2 was below 320 ppm at the time. The hottest temperature ever recorded in the US was 134 in 1913. CO2 was 310 ppm at the time.
Now put your thinking cap on Dennis and figure out what that means.
Gee I don’t know Steven, why don’t you tell me what it means in regards to the “global” climate and how it has changed over that period of time? You are pretty good at cherry picking both time and space aren’t you?
Dennis, if we had a year now half as bad as 1936 – alarmists would be calling for the imminent end of the world.
Steven, It only sounded bad because of the extremely high death tolls, lack of warning, and comparably poor building codes, not based on actual CEI data. The bigger picture of the current climate trends and the more extreme weather is what is alarming, not the cherry picked time slots and events you seem to concentrate on without also presenting the full picture or accounting of the differences between those two time periods. What I am most worried about is your lack of full presentation of the data so that someone can make a more intelligent decision on what is actually happening.
Sounded bad? Coldest month in US history, followed by 25% of the country flooded, followed by massive tornadoes, followed by the hottest month in history, followed by half the country experiencing extreme drought.
By contrast, Jeff Masters gets completely hysterical now over a few weeks of pleasant weather in March.
Now who is sounding alarmist?
Alarmist about 1936?
Steven:
You draw out the most interesting commenters.
It reminds me of the Abbot and Costello routines.
Lol, yes he does. And, while he’s likely not to admit it, I think his new friend, Dennis is getting an education. His position is like many other drive byes. He pops in and accuses Steve on showing only one brief snap shot as representative of history. Which is hilariously ironic because they fail to investigate the corpus of Steve’s work. In other words, they engage in projection.
Steven,
Your argument is based partly on emotion due to the high death toll headlines (can you really tell me in all honesty that you didn’t want that type of reaction from your followers?). Mine is based on actual objective long-term data trends, i.e., the CEI. Yes, 1936 was relatively high (33.6%), but the overall long-term trend of extreme weather at that time was starting to decrease. That is a far cry from the current increasing trend that we have now (peaking at 40.6% last year).
Is there something about the bigger picture trend lines that you don’t like to or wish to acknowledge?
Do you not see how the increasing long-term trends of climate extremes seem to match in time with ever increasing short-term weather extremes instead of the short-term peaks that occurred in the past (mid 1930’s with high death tolls) while there appears to be an overall decreasing trend in play?
That appears to be the difference here between you and me. You like to look at short-term snapshots in time no matter how they fit or don’t fit with long-term trends they are in because these particular events agree with the viewpoint that you wish to convey to your followers. I like to look at the bigger picture trends and how they fit with the current weather extremes. Yes, short term events can occur at any time and can actually run counter to the long-term trends, but overall the long-term trends will create an environment in which there is a greater chance of more weather extremes in the same direction as the long-term trends. It is that picture of long-term trend matching up with extreme events that becomes concerning, not the short-term events that ran counter to long-term trends.
The same goes for global temperatures even when CO2 increases in a continuously increasing direction. Temperatures can at times be lower due to some short-term cyclical events (which can run for 20-30 years), but the bigger picture finds that they will continue to increase in the long-term as CO2 continues to increase.
I have collected thousands of historical records of horrific climate events going back 500 years. I guess that is what you would call “short term.” Hayhoe, Hansen and Dessler pretend that time began in 1970.
No Steven,
You are the one that took a very small snapshot in time (1936) and try to use that data snapshot to supposedly convince people that those that base their conclusions on actual long-term trend analyses of weather extremes are somehow incompetent. I suggest you should look in mirror regarding your own hypocrisy in this matter.
No Dennis, you checked in here really late and missed the four or five thousand posts I have made of newspaper clippings of basically every year from 1800 to 1988. But feel free to live in your fantasy world.
Oh I’m sorry I missed all those great discussions. Did you put them all into proper historical perspective just like you did with this one?
I leave you with this.
Joe Bastardi: “A word of warning to my side of the debate: Low solar, colder oceans, more volcanoes.. If no temp drop in 10-20 yrs, we are wrong”
According to many leading alarmists, the proper historical perspective is to ignore everything prior to the ice age scare of the 1970s.