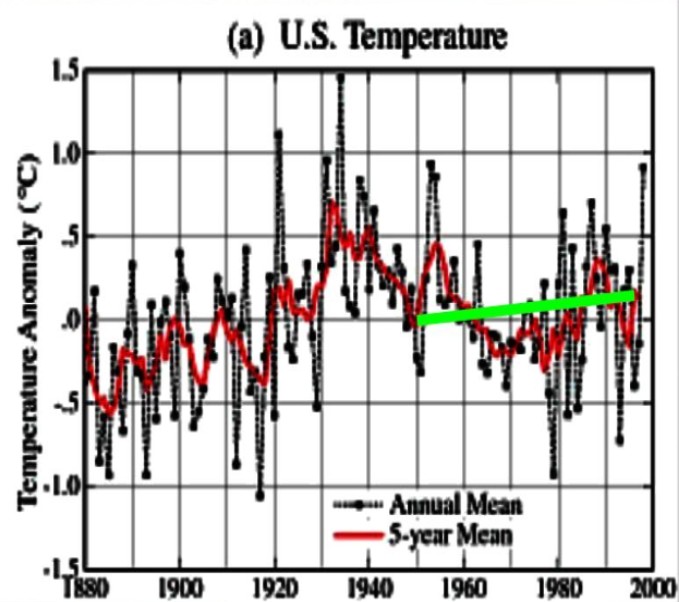
In 1999, Hansen wrote this :
in the U.S. there has been little temperature change in the past 50 years, the time of rapidly increasing greenhouse gases — in fact, there was a slight cooling throughout much of the country
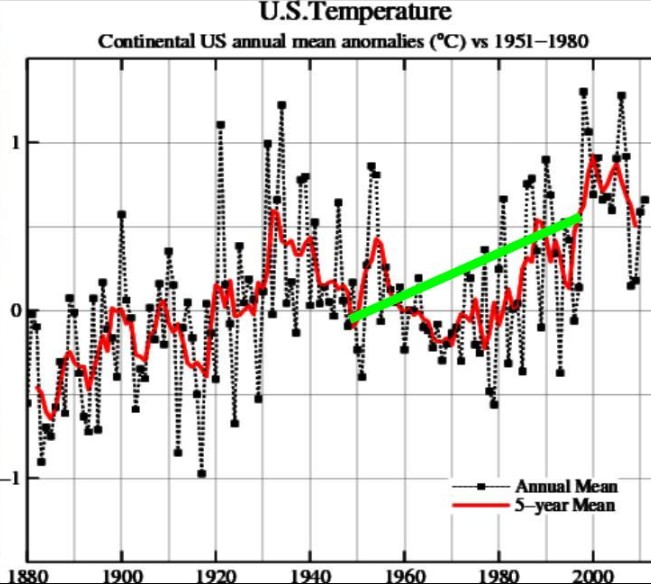
The graph below shows the current GISS US temperature graph, with a line drawn between the 1949 and 1999 five year running mean values. How did “little temperature change” turn into more than half a degree of temperature change?
His 1999 version of the same graph looked like this :
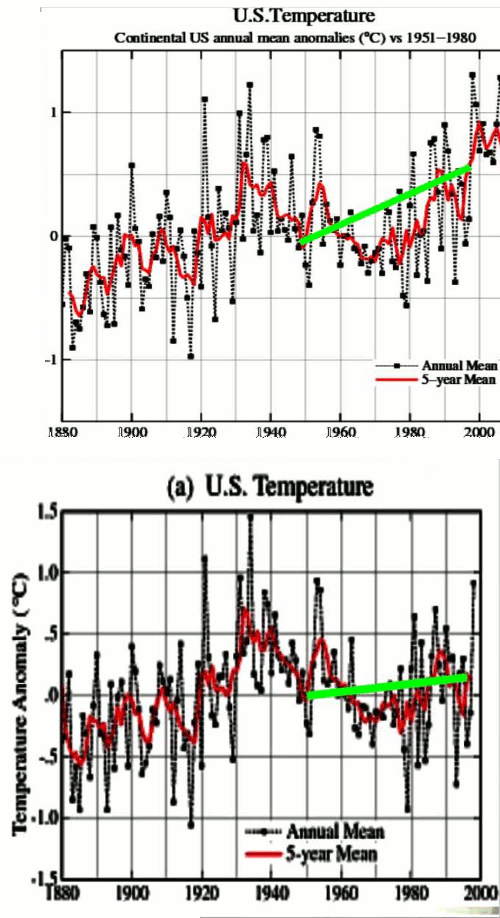
Hansen simply corrupted the data set. The blink comparator below shows what he did in the year 2000 to make the data match his theory.
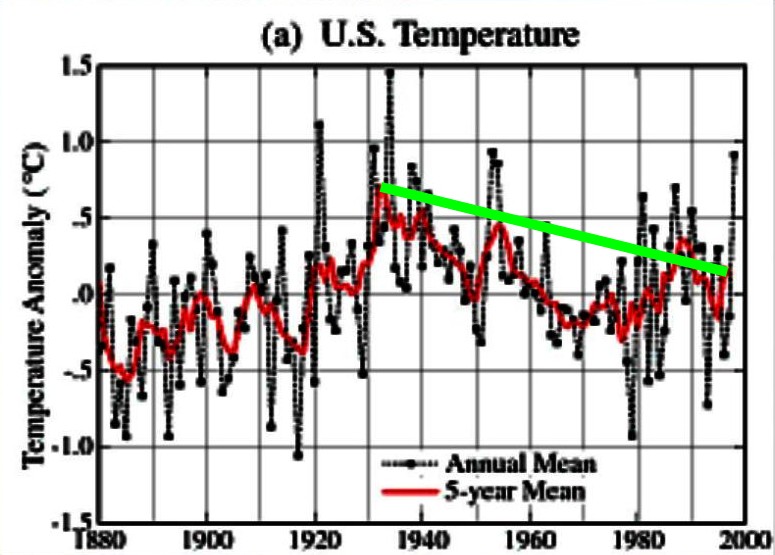
Interesting too that he chose “50 years” as his measurement metric. Why didn’t he start in the 1930s, and show that the US had cooled dramatically?
The GISS temperature graphs are political documents, not scientific ones.


The reason is that it was worse than he thought.
With the right adjustments and extrapolations, the temperature trend can be whatever you want it to be!
well, good grief….it’s only 1/2 a degree
Latitude wrote: “well, good grief….it’s only 1/2 a degree”
The whole frackis is about an approximate 1.25°F increase over the last 160 years or so. Just imagine, if it weren’t for “Global Warming” that record 82° in Chicago last March would have been 81°.
Reblogged this on Climate Ponderings.
In 1999, Hansen wrote this :
in the U.S. there has been little temperature change in the past 50 years, the time of rapidly increasing greenhouse gases — in fact, there was a slight cooling throughout much of the country
NASA GISS: Science Briefs: Whither U.S. Climate?
What exactly has changed since 1999 that has caused him to predict “dustbowlification” for the southwest and midwest?
A complete absence of global warming. That’s what.