According to NASA’s top climate scientist, the oceans are gaining heat (due to man made global warming) at a rate of 400,000 A-Bombs per day. He also tells us that the warmer water causes more frequent and powerful hurricanes.
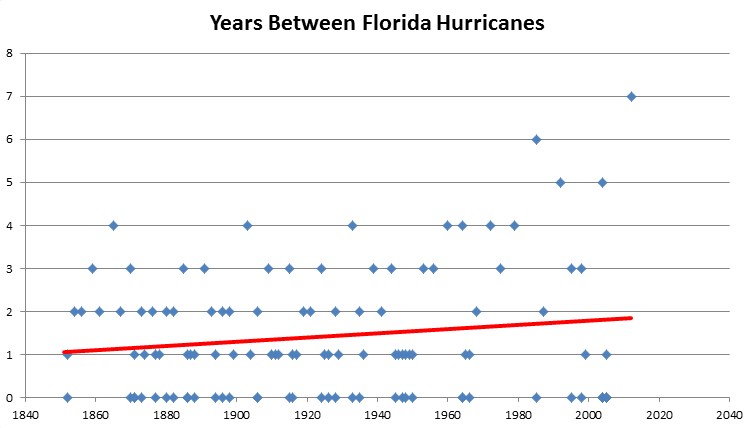
It has been seven years since Florida was hit by a hurricane, the longest such period on record. Florida hurricanes have been becoming less frequent, with the peak decade being the 1880s, when Florida was hit by eleven hurricanes – including two major hurricanes.
www.aoml.noaa.gov/hrd/hurdat/ushurrlist18512009.txt
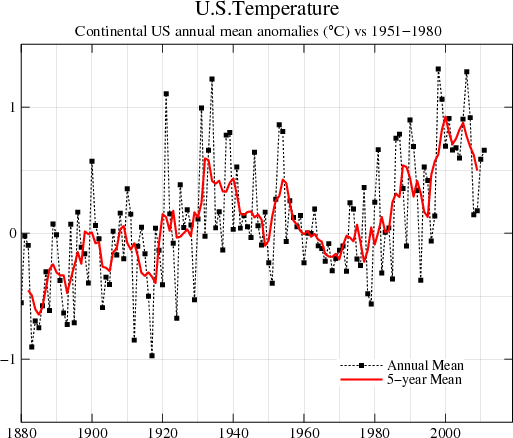
Hansen’s wildly corrupted US temperature graph shows the 1880s as the coldest decade, yet it was the most active decade for Florida hurricanes. Proving once again that Hansen is incompetent, a liar, and an incompetent liar. The left loves him – because he is completely unbounded by the truth.


Steve,
Would it be possible to have each data point represent a FL-hitting hurricane and have the y-axis be the number of days since the previous hurricane? If so, I think you’d find the trend to be even stronger considering that several of the early years have multiple hurricanes in one year, right?
-Scott
Unfortunately NOAA (being a typical government agency) presents the data in a form where it is very difficult to process.
K, I’d be interested to see the results plotted as stated. Clicking on the link, they only have month listed, not days. 🙁 Maybe I’ll take a crack at the data myself to see if I can write a quick script to do it…I’ll let you know if I do it and how it goes.
-Scott
Okay, so I’ve done a preliminary analysis on the method I suggested. Indeed the length of time between subsequent FL-hitting hurricanes is increasing. With each hurricane, the expected time before the next one increases by 2.26 days according to linear regression. In case you’re curious, we should be expecting an average of 21.1 months between FL-hitting hurricanes. I’ll try to get some uncertainty ranges on these numbers soon.
Disclaimer – I had to manually flag hurricanes as hitting FL or not, so I may have missed some. Also, the above data assumes a hurricane hits FL next month, otherwise the recent long hiatus of FL-hitting hurricanes would not be factored in.
-Scott
Okay, finally got a break from work, so ran the regression with uncertainty considerations. At 95% confidence, the number of days between subsequent FL-hitting hurricanes is increasing at the rate of 2.3 +/- 2.9 days per hurricane, so not quite significant. It’s only significant at an 86% confidence interval.
Of course, that analysis assumes that weather patterns are characterized by Gaussian distributions over the period of 100-200 years, which is an assumption I don’t agree with. In fact, I’d say that and similar assumptions are the cause of much of the wrong stuff in climate science (and really any field that tries to make bold claims about the future). Nothing like analyzing a red noise signal with the wrong assumptions.
So, in summary, I’d say that we certainly cannot claim FL-hitting hurricanes have increased in occurence (like the CAGWers believe/want). We can say that there is a downward trend that doesn’t have statistical signficance. Most likely, FL residents should just be prepared to be hit with hurricanes the same as they (should) have for the last hundreds of years.
Somehow, I doubt anyone will read this, but I was just curious so I ran the numbers.
-Scott
Steve, you have discovered another excellent proxy for CACC. Your hockey stick graph is screaming at you, and is obvious to the most casual observer. Fitting an exponentially increasing curve to the data will verify Hansen’s favorite temporal function regarding all things climate.
Please email your result to Mann as soon as possible, so that he can include it in his latest paper on proxy reconstructions of 20th century CACC. Fortunately, Mann has the flexibility to not only flip the sign of the y axis, but also flip the sign of the physical interpretation of the y axis.
This interpretive dance is unique to paleo-climate reconstruction…