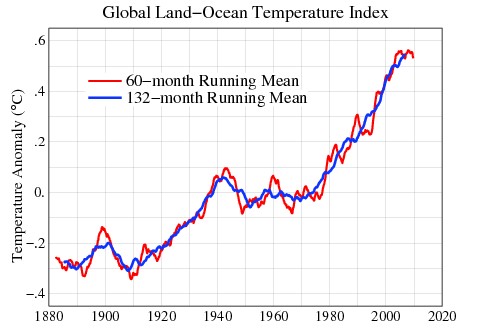
Hansen has this graph of global temperatures on the Columbia web site.
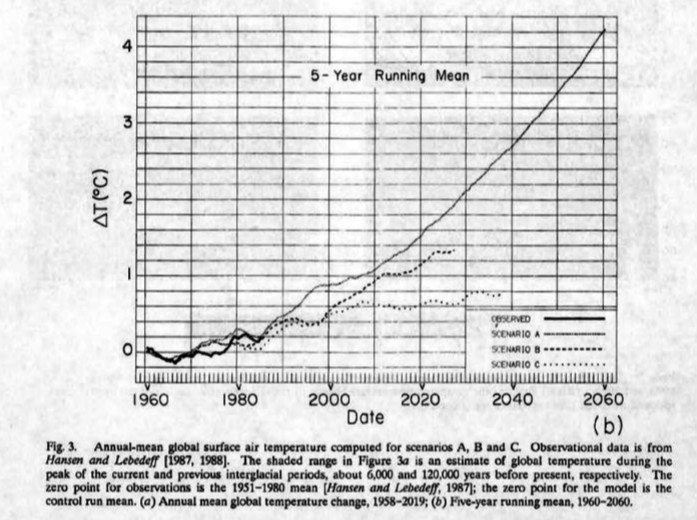
In 1988, he generated these three forecasts for future temperature rise
Scenario A assumes continued exponential trace gas growth, scenario B assumes a reduced linear growth of trace gases, and scenario C assumes a rapid curtailment of trace gas emissions such that the net climate forcing ceases to increase after the year 2000.
Scenario A below assumed that annual CO2 emissions continued to increase, which is what has happened. Scenario B assumed that annual CO2 emissions decreased after 1988, which has not happened. Scenario C below assumes that humans essentially quit producing CO2 twelve years ago in the year 2000.
pubs.giss.nasa.gov/docs/1988/1988_Hansen_etal.pdf
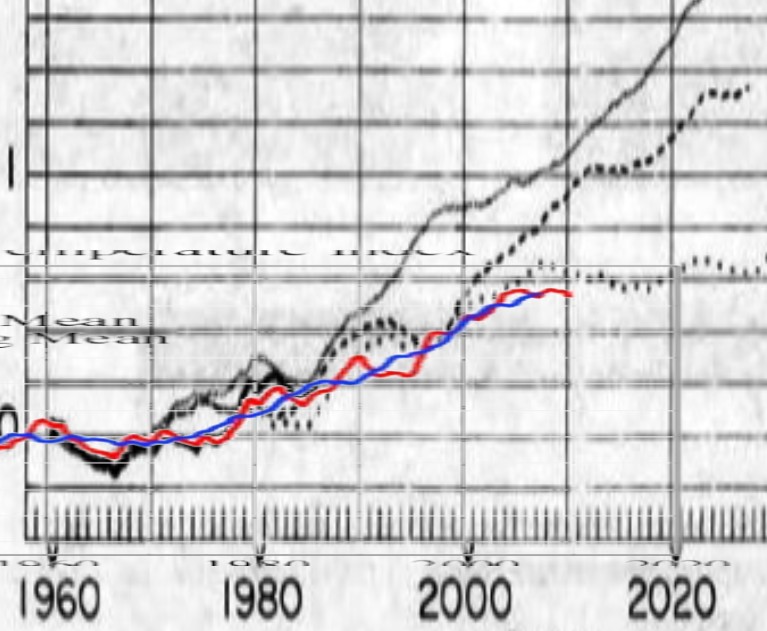
The image below overlays Hansen’s claimed results on his forecasts. Actual temperature rise is less than Hansen’s zero emissions scenario C, and has gone completely flat over the last five years.
An honest scientist would admit that his theory was wrong, and move on. Hansen has instead ramped up the rhetoric, called for 25 metres of sea level rise, and said that people who disagree with him should be prosecuted.
In order to hide the unexpectedly slow increase in temperature, he has also stretched out the Y-axis of his graph. If he drew the temperature graph at the same scale as his 1988 forecasts, no one would even be paying attention any more. The graph below doesn’t look much like a hockey stick.


Plus he has temperatures where nothing but ice exists, and its accurate!!
Lance:
A quote from the GISS web site:
Q. If SATs cannot be measured, how are SAT maps created ?
A. This can only be done with the help of computer models, the same models that are used to create the daily weather forecasts. We may start out the model with the few observed data that are available and fill in the rest with guesses (also called extrapolations) and then let the model run long enough so that the initial guesses no longer matter, but not too long in order to avoid that the inaccuracies of the model become relevant. This may be done starting from conditions from many years, so that the average (called a ‘climatology’) hopefully represents a typical map for the particular month or day of the year.
http://data.giss.nasa.gov/gistemp/abs_temp.html
There is no surface temperature, only Wild Ass Guesses generated by a computer.
Steven, do me a favor and put that last graph in “maps and graphs”…..it’s a good one to link to later
Steven:
Scenario A (BAU) underestimated to actual growth in CO2 emissions, rendering the entire paper useless for more than casting scorn on those who defend it.
Steven:
Here is a little more through presentation of this:
http://www.c3headlines.com/2012/05/connect-the-dots-climate-model-failure-hansen-global-warming.html
I was at C# headlines and found this. I think the presenter is trying to get a position on Comedy Central:
http://www.youtube.com/watch?v=1uxfiuKB_R8&feature=player_embedded
C3 Headlines!
Lol – thank you for that entertaining video 🙂
Let’s assume for a second his theories are correct:
1) He said that the shelves of methane have been melted before, yet earth never turned into venus.
2) He said this would take many centuries to happen, yet we have enough fossil fuels for about a century.
3) If it is so easy to turn earth into venus, then why hasn’t that happened in the past when CO2, temperatures, and humidity were much much higher?
That’s just a few things I think he hasn’t considered. But hey, how boring would the world be without crazy people?
Right!
It is the Crazy people that make life interesting.
It’s still much worse than we thought! How else can it be explained that we have had at least 3 extreme, permanent droughtfloods in less that a year? Dr. Hayhoe states that the Texas extreme permanent droughtflood might last 1,000 years!
That word, droughtflood, had not been invented until a year ago and now they are happening all the time. Also, much bigger hurricanes in the pipeline, even if they never happen! Global Weirding is real and will destroy us all!!!
The rise is CO2 has caused the thesaurus overuse tipping point to be reached, releasing catastrophic global etymology failure.