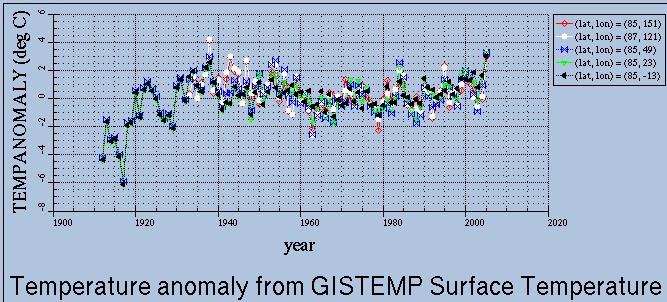
A tip by Juergen Uhlemann led me to this. As of 2006, Hansen showed that essentially all Arctic warming occurred prior to 1940, with a dip during the 1970s.
ftp://ftp.giss.nasa.gov/pub/gistemp/netcdf/
Hansen’s original data agreed with the newspaper reports I have been printing. What happened since 2006 to change the data?


What happened since 2006 to change the data?
….temperatures went down
Where did they get these from? The positions are all in the Arctic Ocean, far away from land with temperatures going back to 1912. Does not compute.
I’ve heard that temperatures on the Atlantic side of the arctic are quite sensitive to the AMO. Does this chart correlate with the AMO?
Reblogged this on Climate Ponderings.