Globally, NOAA reported in May that the average temperature in April was 1.17 degrees warmer than the average from the past century, making it the fifth-warmest April since at least 1880.
It was the 326th consecutive month that global temperatures exceeded the 20th-century average, NOAA said.
More record warmth as scientists warn of global tipping point – CNN.com
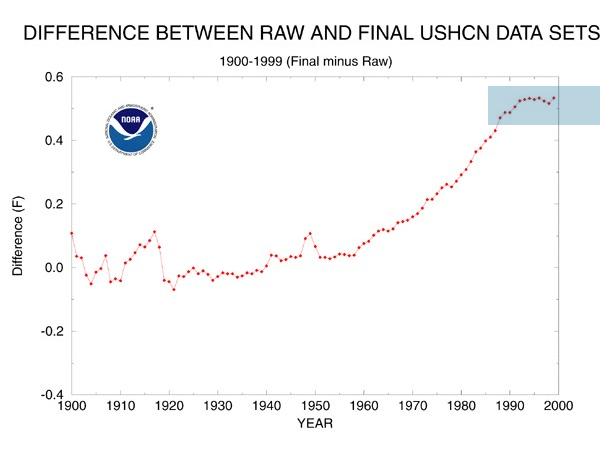
Here in the US, these same good people at NOAA have been adding half a degree on to all temperatures for the last 326 months. Then they tell us that we need to have our taxes raised, because their inflated temperatures have been above average for the last 326 months.


Where is the data plot for after 1999?
Take a wild guess.
No clue.
This is the latest graph on the website. http://www.ncdc.noaa.gov/img/climate/research/ushcn/ts.ushcn_anom25_diffs_urb-raw_pg.gif
Then again, a lot of data tends to be hidden from scrutiny.
I’ve seen that chart many times over the last several years, and I’ve always assumed that the 1/2 degree continues to be added to the raw data right up to the present day.
Oh, I should say that I assume the 1/2 degree is also added to the global data, USHCN is only the United States data.