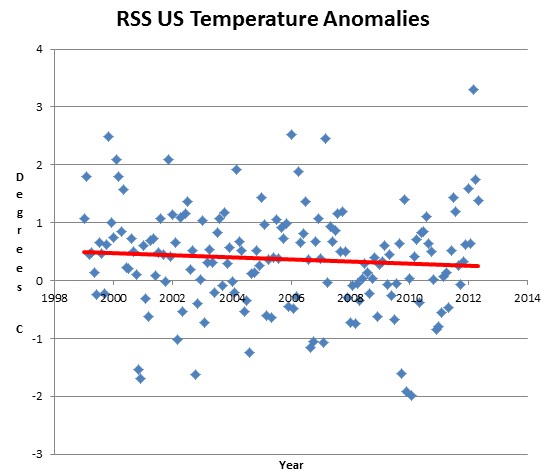
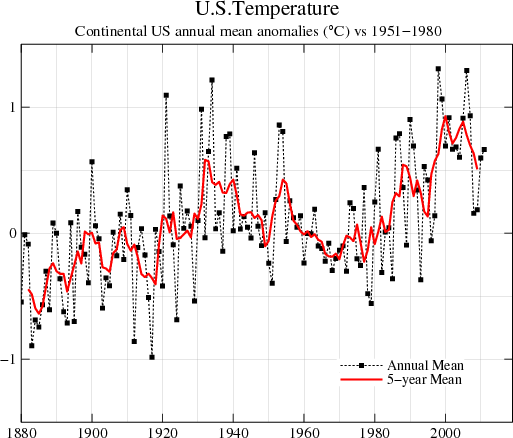
In 1999, Hansen told us that there had been no warming in the US since 1950.
in the U.S. there has been little temperature change in the past 50 years, the time of rapidly increasing greenhouse gases — in fact, there was a slight cooling throughout much of the country
And since 1999, the US has cooled.
RSS_Monthly_MSU_AMSU_Channel_TLT_Anomalies_Land_and_Ocean_v03_3.txt
Despite the lack of warming from 1950 to 1999, and the cooling since 1999, Hansen now shows a strong US warming trend since 1950.
In Hansen’s world of climate data tampering, you can add a negative number to zero – and get a positive number.


Hansen must have done something like this:
http://www.thescienceforum.com/mathematics/2861-4-5-proof-whats-wrong.html
Hansen has unilaterally given himself the right to adjust any temperature any way he sees fit, even if he is clearly making it up on the fly. Then his underlings parrot back his own adjusted data, showing that the last 326 months have been above normal, to prove he is “right” about warming. Quite a 3rd rate shell game!
You don’t even need the RSS plot here, you can show it all using just NASA/GISS alone…use the 1999 quote and then just take the 1999-present section of the second plot.
-Scott
Goes GISS publish US temperature data?
No clue Steve, but your second plot is more than enough to go on…you could extract the data with pretty low uncertainty from the second plot digitally. Your graphics skills are well beyond mine, and I’ve extracted similar info from papers in my field where no data are numerically presented but only presented in graphical form.
-Scott