Guest Post By Joe Bastardi
Sound Meteorological reasons for US temperature fluctuations as the globe cools overall
The last year the US has been warm and it can be directly traced to the changes taking place in the Pacific as the cooling PDO deepens, resulting in a fall in global temps, but rapid responses up and down across the US based on the water in the tropical Pacific. The theory is simple. The cooling of the Pacific tropical waters overall forces a global reaction that leads to the start of the cool down, that will be shown In a chart below, but the US temp response is inverse to the temps in the central Pacific relative to the temps In the eastern Pacific . The physical reaction will be discussed below, and it will be made clear as to why simply looking at what is going on over 10% of the globe is pure agenda driven drivel that the AGW crowd , pushed by many in government and science in this country, can be revealed as ignorance to basic sound logic, common sense, and science
The key is that no matter what the water temp, it has to be warmer in the central Pacific than eastern Pacific. If you have a warm event going on ( the el nino) then the core of the warmth must be in the in the central Pacific. If a cold event ( la nina) then the only way the US is cold is if the water is colder near South America. If the core of the cold is back west, then it creates a pressure and temperature pattern across the globe that will force it to be warm in the US . The same type of thing happened in the mild la nina winters of the MID 1970s, before the reversal in the late 70s, something I believe could happen this winter!
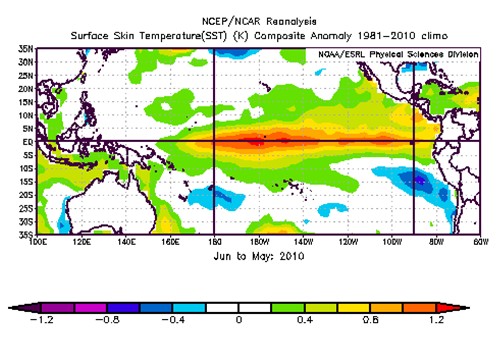
in a cold regime, lets look mid 09 to mid 10 its warmer in the center
so you understand the physical reasons, it has to do with the overall global temp and the results of warming and cooling of this area of immense energy on the global pattern. Warm the water in the central pac and you create lower than normal pressures in this area and there has to be compensating rises in pressure over N America. This is greatest in the winter season. Why? because in the tropical pacific seasonal temp variaions are much less than in the temperate regions, so a slight pressure fall here because of warming will demand a bigger response to the positive where its cold, again remember the lesson of the cold morning vs the hot afternoon and how easy it is to get temps to bounce up and down when its very cold ( takes very little energy change) as opposed to when its hot. The same change in energy for 1 degree at 80 will produce more than a 15 degree change around 0.
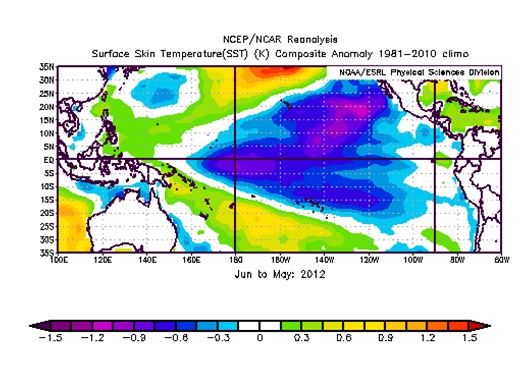
Now look at the Pacific while the US has been warm over the last year
This demands a warm response somewhere and its over the US. But it shows in no uncertain terms why the AGW crowd argument lacks sound physical foundations. They are clueless as to the true downturn that is in progress here in terms of the reduction of energy, or if you will the turning down of the earths thermostat and so they focus on the one area it was warm, the US. But you can see the rapid reduction not only in this crucial area of energy, but in the mid troposphere. It shows, with the statements made by people on the US warmth, an amazing lack of actual examination of the weather and understanding of climate cycle theory. To them any fact that wont agree with them, no matter how soundly based in physical realities, does not exist
IT HAS TO WARM OVER US WHEN IT GETS THIS COLD IN THE CENTRAL PACIFIC but the overall affect on the globe if we integrate from the surface to where their trapping hot spot is supposed to be is for a fall in temp! But do we hear that? Of course not, all we see is their head in the sand, refusing to look at the entire picture so they say the globe is warming EVEN WHILE THE ACTUAL TEMPS SAY ITS NOT
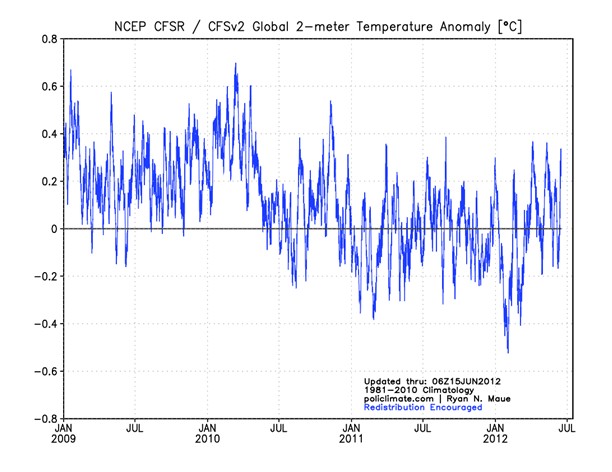
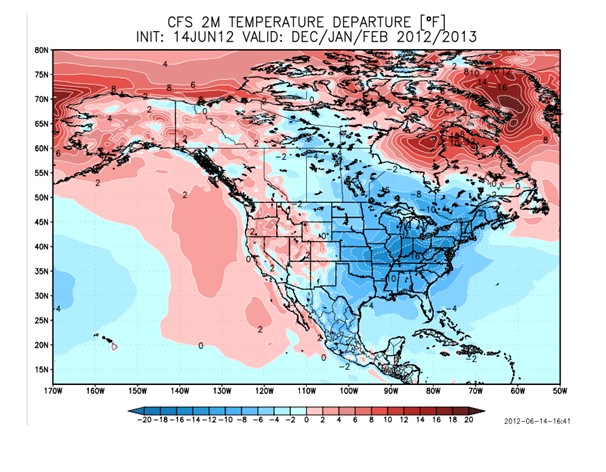
So you hear one nonsense statement after another come out that will not confront the physical realities of the flip in the climate cycle that is starting to occur. In the shorter term decades, its all the oceans since they have 1000 times the heat capacity of air. In the bigger picture, of course the sun. We look here at 2meters on cfsr which by the way is an NCEP product, not Heartland Institute or EIB. It’s the National Centers of Environmental Prediction
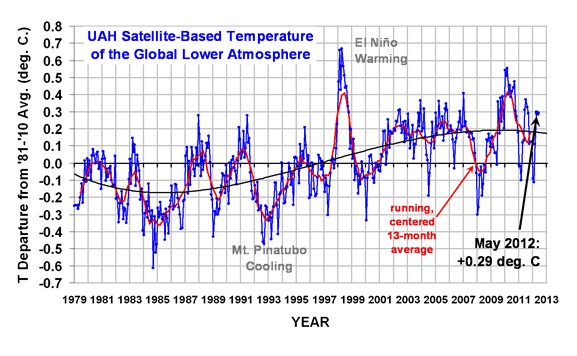
You would have to blind not to see the same jagged trend down has started since the pdo flipped to cold, that started up in the late 70s and 80s when it flipped to warm. In the Bigger picture, Roy Spencers chart which starts when the PDO flipped to warm, but after leveling off is also starting to show the downturn
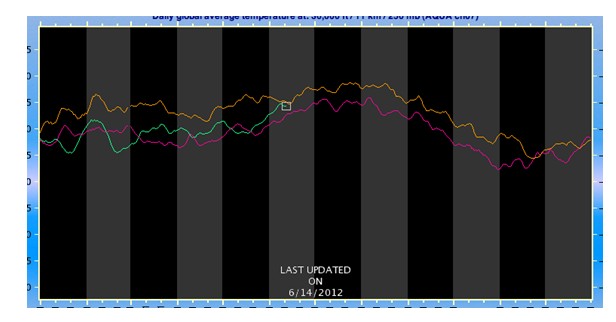
and we can look at 14k seeing how warm it was in 2010 and how it cooled since then ( the tan line is 2010)
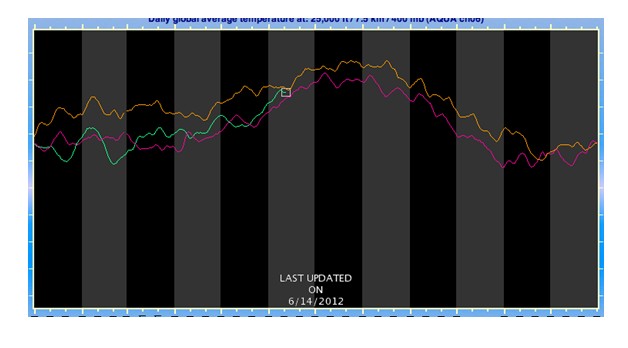
and at 25 k, the bottom part of the “trapping hot spot” ( tan line 2010)
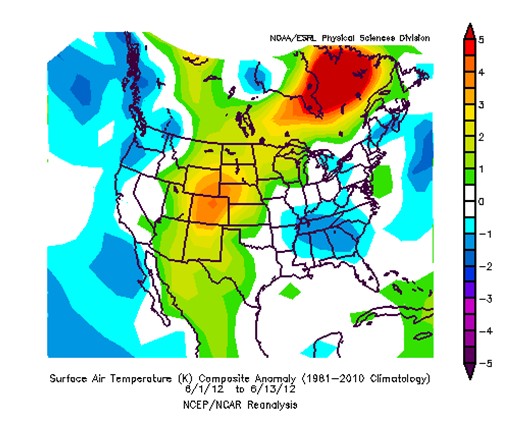
So when you look at this
and find its the coolest start to a month, though its still warm overall , you can so say “so what” or you can understand that given the theory I am laying out here and have been for a few months now ( remember I forecasted a surge in global temps against the normals for spring and early summer, so this is not a surprise) you can see why what is rumbling around now may be the start of the atmospheric avalanche that the CFS is not shy about touting
this would be as bad as any winter since the late 1970s. let me be clear I think a colder winter is on the way, but this model is carried to the extreme! That being said, there were physical reasons that do not have anythng to do with this agenda driven drivel of co2 that people are spouting that lead to last winter just like the natural variation will lead to this winter. So I outline those first for you. Of course the crowd I must deal with would take a winter like this and twist it to somehow be because they are right. But they do that after the fact with everything. But explaining the why before the what and at least giving you the chance to see why something may be happening, we can expose these people for charlatans they are.. Sound reasoning and common sense can prevail even in this age of Utopian Voodoo


Wow! This could be some kind of winter coming up with DC near the epicenter.
I don’t like all the heat up north, why isn’t that area colder also?
Joe, thanks for your predictions. And, yes, I recall what you stated a few months back. You’re laying out the theory quite nicely, though, I’m going to have to re-read your earlier post and this one a couple of times.
I’d like to say I’m looking forward to your victory laps, but I hate cold winters. 🙁
I’m confused, how was this laid out clearly? The grammar alone is hard to follow in Joe’s post let alone the way he tries to present his “theory”. I don’t think anyone would argue that there is a lot of natural variability in our climate. Just because we’ve had a few record or near record warm months, doesn’t support any greenhouse gas climate theory. It’s not the bumps and wiggles that matter. It’s the long-term trend. And until someone can quantify the factors behind the long-term trend, this debate is going to continue. While scientists have proven that CO2 absorbs infrared radiation and results in warmer temperatures, there is also so much natural variability happening at the same time that it’s impossible to say x% of warming is CO2 and y% of warming is solar activity and z% of warming is sun’s position relative to the earth, etc. That’s the problem as I see it. But we do know that our human activities are increasing CO2 concentrations in the atmosphere and that this does cause a warming, it’s how much that is the real question. This warm spring is nothing special…
For the x’s and y’s, you could start by reading:
“Global temperature evolution 1979–2010,” G Foster and S Rahmstorf, Environ Res Lett 6 044022 (2011)
http://iopscience.iop.org/1748-9326/6/4/044022
You could start by downloading and running RRTM, the radiative transfer model used by NCAR. Then you would find out just how poor your understanding of the CO2-temperature curve is.
And how do the results of your RRTM runs differ from those published?
If you run the models, you will find
1. In any place which has a moderate amount of humidity, CO2 makes up less than 5% of the greenhouse effect 2. The vast majority of the CO2 effect is caused by the first 20 ppm.
That’s nice and nonspecific, which is what I expected. Where can I read about the details your results?
Like I told you the first time, download RRTM and run it yourself. I have published details lots of times.
http://stevengoddard.wordpress.com/2011/04/24/co2-accounts-for-1-3-of-the-greenhouse-effect-in-the-tropics/
Indea, you’d have to read his earlier post. Yes, the grammar must be parsed, but that’s pretty doable. If you have questions, ask Joe.
The long term trend….. since when? All we’re seeing is the natural movement away from the LIA. Yes, CO2 absorbs a miniscule portion of the IR and some of the energy gets sent back to the earth. And, if that’s the way things ended, one could say they’ve shown that increased atmospheric CO2 increases global temps. But, that’s not where things end. That’s just one step in a walk to infinity. There is absolutely no one on earth who knows where that dance ends. For all we know, increased CO2 can cause cooling. Why? Because the earth has other mechanisms in place which respond to changes. It is simplistic and sophomoric to simply state increase atmospheric CO2 increases global temps.
The “long term trend” is another laughable expression. How long? Starting when? I’ve demonstrated where our measurements show a 70 year period of time with decreasing temps in spite of increase atmospheric CO2. And people wet their pants because of the 20 years (80s and 90s) that our temps went up. It’s hilarious, or it would be if it wasn’t so fraudulent.
I don’t see any details on that link, and that’s where the devil lies. Calculating the global greenhouse effect isn’t just a matter of calculating the Planck effect in a small latitude range. What about an integration over all latitudes? What temperature profile are you assuming (variation with altitude)? What if you remove CO2 everywhere (see Lacis et al, Science 330 356-359 2010)? As CO2 is removed and the temperature falls, cold air holds less moisture and the temperature falls even farther. The caps freeze and their albedo increases and temperatures fall further still.
Simply running a radiation code isn’t proof of anything relevant.
For the third time, download RRTM and run it yourself. RRTM LW doesn’t care about latitude. The tropics reference has to do with humidity.
Joe Bastardi rocks !
Looks like a ‘normal’ winter in alberta…cold, broken by the odd chinook…compared it against Environment Canada’s forecast and they match pretty close,but they have alberta above normal…
time will tell…
http://www.weatheroffice.gc.ca/saisons/image_e.html?img=ccatemp_09_s
Hey Steve, your friend Katherine is at it again, she’s only a co-author, but, she seems to be the one heading the media blitz…… climate change will cause more fires!!
paper here. http://www.esajournals.org/doi/full/10.1890/ES11-00345.1#cor1
I wrote a little on this, but, its much more in your purview than mine. http://suyts.wordpress.com/2012/06/15/hayhoe-is-at-it-again/
The heat in Texas seems to have made Canadian Bacon out of her brain.
Lol, she’s says we’ll all burn for that!!! It is a precious paper. There’s no data to look at. The models agree more, the further out into the future. Clearly, the less that is known about future conditions, the more able our models can predict them. I couldn’t find anything which quantifies our fires we’ve observed, but CO2 emission estimates from fires doesn’t seem to correlate with anything.
Canadian Bacon! MMMMM… Brains? Not so much. Hayhoe’s brains compaired to any kind of bacon is out right disgusting. Shame shame 😆
I live in Puerto Rico and these past two winters have been cooler than the rest. I see the graph predicting the extreme winter, and see the extent of the blue. With that been said, can we expect an even cooler winter this year…or were the past two years just abnormality? I hope the trend continues!
My gut tells me this will not happen. Surely it will be a stronger winter than we got down here last year, but I doubt it will be as bad as your map suggest.
that is NOT MY FORECAST. It is the daily run of the model that you can see on Weatherbell. How do you not see it says CFS! My point is the models are seeing cold, We have the winter 2-3 below normal from Texas to New England and into the Ohio valley which is like 02-03!
It is not my map, It is a computer forecast that you can get on our site as we make it available, but I am showing people how the model is seeing the warming in the cent pac and detecting the cold, in line with the theory.
That is frustrating. if you want the actual forecast, you should become a client. I am trying to show folks the ideas that lead to the winter, and specifically said the model is going wild
I mean, look at the quote underneath:
let me be clear I think a colder winter is on the way, but this model is carried to the
extreme!
My gosh, its all there
Joe, how accurate have the models been in recent years? (Is there a study or systematic review somewhere?)
And what is the uncertainty range of their predictions as a function of time into the future?
No need to get snippy dude.
Asking about model uncertainties and accuracy is “snippy?” What would call the rest of science?
I was talking to Joe.
Thanks — my bad.
Very fascinating Joe. Let’s see how it plays out. The Libtwits need to be shocked into reality.
I love how my little corner of the country isn’t so cold. Awesome! I hope DC is an icebox.
Thanks for another great forecast.
Hi steven, i’m from italy it’s a lot of time that i follow your opinion about global warming, so i show you in which way the data are manipulated:
you can use for it this link http://akweathercams.faa.gov/ from Federal Aviation Administration
and compare with data from NSIDC so let’s start with map 🙂
http://majikimaje.com/images/getmap.jpg to find the places to which we are interested
then we see the NSIDC see ice concentration
http://nsidc.org/data/seaice_index/images/daily_images/N_daily_concentration.png
and then
find for example two place where the ice concentration should be 0 Z E R O OK?
so here you are http://akweathercams.faa.gov/wxdata/179-32583.jpg barrow completely frozen sea
and
Point Hope (find in the map) in the middle of boering street on the coast http://akweathercams.faa.gov/wxdata/198-67573.jpg completely frozen sea
so the Image reconstruction is completely wrong. That’s all.
sorry for my awful english
Thanks Drago,
There are several miles of landfast ice at Barrow, but after that it is open water. The resolution of the NSIDC map isn’t high enough to show that thin sliver of landfast ice.
Don’t know if you caught this….. But, David seems to be backtracking on his position with Jones being en excellent scientist. Commenter Me extracted this.
His question, identical to Jones’ “Why should I make the data available to you, when your aim is to try and find something wrong with it?”
Your response, “Because presenting your data is the essence of science.”
http://stevengoddard.wordpress.com/2012/06/12/david-appell-mann-is-an-excellent-scientist/#comment-95182
Just above that comment is the exchange. lol 😀
Your slavish adherence to ENSO and PDO ‘flips’ does you no favors Joe! I would be interested to learn of your history (if any) with the University of East Anglia and their ‘exported’ Forty Year El Nino Fantasy.
As defined by Alex S. Gaddes in his book ‘Tomorrow’s Weather’ (1990) Global precipitation (and therefore surface temperature) is influenced mainly by orbital Solar Induced ‘Dry’ cycles, and the ‘Wet’/Normal Periods between them. America is currently in the final throes of a One Solar/Earth Year ‘Dry’ Cycle. (Florida flooding, Colorado wild-fires.) Australia is five months into this Cycle. The Indian Ocean longitudes to the West of Australia are experiencing the subsequent Two Solar/Earth Year ‘Wet’/Normal Period that has covered most of the planet (thirty degrees of longitude/month with the Westward Solar orbit of the Earth’s Magnetic Field.) This Two Year ‘Wet/Normal Period will completely overtake America by July 2012, resulting in two years of increased precipitation/snow, reaching Australia early 2013. It is of note that Australia is one of the last countries longitudinally to be influenced in the orbit of these Cycles.
The next ‘Dry’ Cycle will start to the West of Australia in early 2014, reaching the Australian East Coast in turn in early 2015 and lasting Five Years.(2015 -19.) You will note that these Cycles orbit from East to West, in the opposite direction to prevailing weather (axial spin.) An updated version of the above work (with ‘Dry’ Cycle forecasts to 2055,) is available as a free pdf from
[email protected]
The CFS is wrong, it is NOT going to be 16 degrees below average across the Ohio river valley.
I could see -4-6, not 16.
I said it was overcooled, but 4-6 below normal is a heck of a winter. Look at 09-10
BTW i currently have it 2-3 below normal
Thanks for the input Joe , and thank you Steven for posting. I like the idea of someone stating a factual reasonable prediction that can be verified in a matter of months or a few years versus the AGW crowd which always places their predictions too far out to verify in a lifetime. You have been reasonably accurate Joe, whereas the warmists have yet to be accurate in any of their predictions. They always come along after the fact to tell us we don’t understand what we are looking at and blah blah blah give us more money and power and worship the models. It is coming to a head now as the co2 is still rising and the temperature is not. At least the honest temperature isn’t , although Jimmy Hansens meddleing shows otherwise. The politics of power is the issue and the fact that we have let 50 years of out of contol government destoy our constitution until we look like any other communist nation, you know broke and with freedom greatly curtailed. We’ve let the dogs run the country way too long.
Jo and Steven thanks for the info sure looks good.
As I usually read other blogs I came across this at
http://chiefio.wordpress.com/2012/06/14/lake-eyre-to-fill-or-not-to-fill/
in reply to some comments. I feel it has a lot of merit in it.
“Haven’t done the work with the precipitation data to show if the thesis has anything to it or not.
Just based on my observation that after the snows of the ’60s / early ’70s in the Central Valley of California, we had a cold drought in the late ’70s / early 80s as we entered the warming phase. Just about the time everyone was saying “OH GOD! Hot Droughts!”, we’ve gone back to wet… on the way to cooling. Don’t know if it holds up in other geographies or if it’s just a California pattern. I think I’ve seen the same pattern in Australia, but an opposite pattern in other parts of the world. (China right now has had onset of droughts…) IMHO there are dipoles of opposite drought / rain and simply using broad averages will hide the pattern. So one needs to look at historical patterns of drought to figure out who gets the rain when. (China / Australia look to be opposites. Don’t know where India falls out, but IIRC it was prone to failure of the monsoon in the ’60s – ’70s when Australia was getting rain?)
At any rate, I think it’s a potentially fruitful thing to pursue… just need a second lifetime and funding to get it all done 😉
So watch the 60 year pattern and think of water as the working fluid transporting heat; then it looks to me like it fits. When the heat is accumulating (starting from a cold end hot phase) low rain, when heat is leaving (starting hot ending cold phase) lots of rain. Watch Queensland for inflections. IMHO their floods of the last couple of years were the turn from warming to cooling heat flow. Similarly the torrential rain in places like the Philippines and Taiwan. (Texas drought seems to come at / just after the heating top…)”
What do you think?
“Another Joe Bastardi Failed Prediction,” 1/19/12
http://davidappell.blogspot.com/2012/01/another-bastardi-failed-prediction.html
BWAAAAAHAHAHAHA!
http://www.youtube.com/watch?v=ZSG47_-Ne9o
http://www.youtube.com/watch?v=eFwkv14u3b4
Dave, the main aspect of my forecast is by 2030, NHem temp as measured by objective sat temps and the sea ice returns to where it was when we started the satellite era. As you have picked out me being wrong here, and of course this will be the kajillionth time I have admitted it, I realize that you and your 113 followers or whatever need to hear that I know I am wrong. Since you wish to bring it up again, yes I was wrong about that.
By the way, that forecast also calls FOR A REDUCTION of southern hemisphere sea ice a it should reverse its trend. If it doesnt, than we are in a heap of trouble the other way.
Since I forecast every day, and dont get paid unless I show my clients the value of being right, rather than blog from my basement or wherever it is you are, and since outside of 1 month between jobs I have forecasted every day for the past 10 years, starting working in the field the day after graduation on March 4,1978 and was at the same company for close to 33 years, I would say me being tested in the field far outweighs yours, the weather equal of the fan that eats hot dogs, sits in the stands, and thinks he can play on the field with people who actually know what its like to compete
Nice! LMAO!!!!!
For the record, and here you are Dave and the rest of the bunch, I think sea ice this year reaches its lowest levels a bit sooner than normal, and comparable to the lows measured in 2007. That being said, the peak this winter I have a little higher than last winter. I am using the Arctic ROOS site
http://arctic-roos.org/observations/satellite-data/sea-ice/ice-area-and-extent-in-arctic
as I think this is the most objective dog in the fight, and will not get me in trouble with
NSICD who I have no quarrel with. But using a non US source that has a long track record will mean no one can question my objectivity.
And by the way, though the ice is forecasted to be near the 2007 levels, that is still a far cry from the forecasts made for no ice at all at the end of the summer melt season of 2012. But there is the forecast, so lets see how it works
I bet you if ice winds up HIGHER than I am saying, we wont hear anything about that being wrong
I hear ya! Been there and seen it!
You mean we can objectively track the people who are more often right than wrong? Joe, what is this madness you speak of? Next thing you know people will actually start keeping track of how many times the lunatic fringe were right vs wrong!!!
We mustn’t have that. People would start questioning their knowledge and ability.
Im a fan JB…but im seeing a warmer arctic on that f-cast map this coming winter..how does that translate to a higher ice maximum?
Fishnski,
Good question. But because what you say makes too much sense, did you notice how Joe simply ignored it. You have to remember, to be a dedicated member of Joe’s world of true believers, you should never question what he says even if what he says happens to contradict his own maps or is not based on meteorological common sense.
That’s it then; this winter I’m going boating in James Bay.
The current ‘warming’ in the Pacific Joe, is the influence of a ‘Dry’ Cycle, due to finish over the Indian Ocean due west of Australia in early 2013. (Thirty degrees longitude/month, with the Westward Solar orbit of the Earth’ Magnetic Field.) Nothing to do with ENSO/La Nina, or AGW!
I also remember when you were vehement about how the winter would change dramatically last January. You were tweeting like crazy about how much a change could be expected. What followed was a continued warm winter followed by an even warmer spring. You could be right, I suppose, but then, so could throwing darts. Your collection of endless tweets about how sure you were in the middle of January only proves how inaccurate long range forecasting is. In fact, you also stated in Fall of 2011 how the entire winter would be cold. That, obviously, did not materialize. I guess if you keep forecasting cold, it will eventually happen and you can say you were correct?