Global warming may push sea levels as much as a foot higher in California in the next two decades, threatening airports, freeways, ports and houses, according to a report examining risks along the U.S. West Coast.
Increases are forecast to be greatest south of Cape Mendocino, with levels rising 1.5 inches to 12 inches (4 to 30 centimeters) by 2030 and as much as two feet by 2050, according to a report today by the National Research Council. In Oregon and Washington, increases may be more modest, because land also is rising
Global Warming Seen Lifting California Sea Level a Foot – Bloomberg
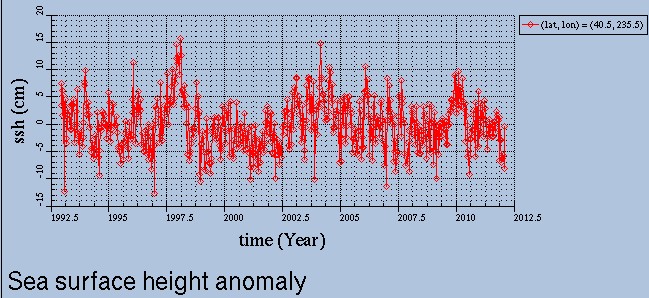
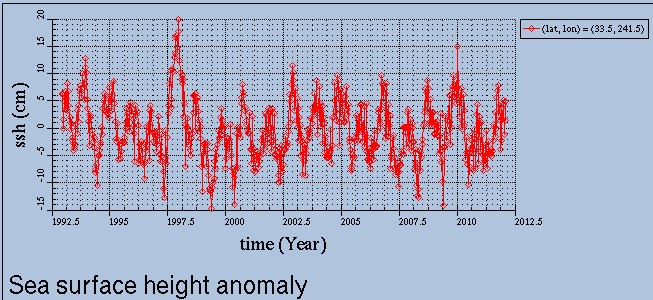
Satellites show no sea level rise off the coast of California since they started taking measurements twenty years ago. Satellite measurements are unaffected by changes in the height of the land surface, because they are measured relative to the satellite’s orbit rather than the coastline.
Cape Mendocino
Los Angeles
The norm for climate alarmists is to lie, cheat, forge, defraud – and whatever else it takes to bring money in.
h/t to Marc Morano


I will read the whole report and get back to you guys on this. I did note this from the report, though:
“Increases of 3–4 times the current rate would be required to realize scenarios of 1 m sea-level rise by 2100. Such an acceleration has not yet been detected.”
Hmmm…..
An immediate red flag for me is that they are citing those junk science sea level hockey stick papers again. (I see that Rahmstorf, Kemp and Mann’s papers are heavily focused on. To be honest, those papers are a bit of joke. One of them extrapolates global sea level rise from a single tide gauge. WTF? The rest of the data is highly ambiguous or based on ‘computer models’ with rather tenuous assumptions built in.)
Sadly the NRC, the US NAS, the UK’s RS, the UN’s IPCC are all using the techniques of “postmodern science to promote the UN’s Agenda 21 [1] by building a tyrannical, one-world Orwellian government [2] to protect world leaders and the rest of society from possible destruction by “nuclear fires”.
This agenda was established by world leaders in 1945 in response to the sudden release of energy (E) stored as mass (m) in the cores uranium and plutonium atoms on 6 Aug 1945 and 9 Aug, 1945, respectively.
See: http://omanuel.wordpress.com/about/#comment-142
With kind regards,
Oliver K. Manuel
Former NASA Principal
Investigator for Apollo
http://www.omatumr.com
References:
01. Earth Summit Agenda 21: United Nations core publication on action plans adopted in 1992 to be taken globally, nationally, and locally on the environmental impact of humans): http://www.un.org/esa/dsd/agenda21/
02. George Orwell, “1984? (Harcourt Brace Jovanovich, Inc, 1949, First Signet Classic Printing, 1950, 328 pages): http://www.online-literature.com/orwell/1984/
I found an endorsement of the NRC
“The National Academy of Sciences is the nation’s pre-eminent independent scientific organizations. Its members are among the most respected in the world in their fields.”
– Peter Gleick – Chairman for scientific ethics, of the American Geophysical Union (formerly)
link
From Point Reyes (50km NW of San Francisco) southward, sea level hasn’t risen since 1980. North of Point Reyes, it is falling over the entire record, for example at Crescent City a relatively steady -0.76 mm/year. This inconvenient but large stretch of coast is ignored in the “report” – why?
At Alameda Naval Air Station in SF Bay, sea level hasn’t risen over the record since installation in 1939, and has been dropping since the mid-1960s., while nearby city authorities wring their hands over the “coming apocalypse”.
GPS data for southern California agrees with the report however, with the land generally falling by several mm/year, which means that sea level is actually falling at about that rate since 1980. Just look at the wide ranges in the “predictions”. It’s pure, unadulterated bullshit, with a large side order of alarmism.
Tide gauges in Southern California show no change in sea level over the last 20 years.
That’s precisely what I said, except I said from 1980. If they show no change, but GPS shows a few mm on average drop in land hight, then the actual sea surface must be falling by that amount.
Another asinine doomsday prediction by the crystal-ball gazers posturing as serious scientists. Don’t these charlatans realize how absolutely stupid they look when they trot out this unscientific balderdash?
This may come as a shock to the Michael Mann hockey stick worshipers in government and academia: global temperatures stabilized in the late 1990s and are now on the decline. It appears we may soon enter a period of long-term cooling — driven by the cold PDO (and soon, cold AMO) and plummeting solar activity.
A solar-driven Dalton or Maunder Mininum would put the northern temperate zone into a deep freeze. We would then see a truly horrific outcome: a reduction in corn and grain production as agricultural production is forced south from more northern lattitudes, causing food shortages and widespread hunger. Millions of people might starve.
It is a colder climate we should be worried about, not the imaginary impacts of coastal flooding based on the half-baked predictions of government-funded soothsayers.
Seems 2050 is the alarmist year.
I don’t use NOAA graphs, but just happened to check one after this “California is doomed” garbage hit the headlines. Have a look at any station linked from
http://tidesandcurrents.noaa.gov/sltrends/sltrends_states.shtml?region=ca
and notice that while data is plotted to end 2011, the trend is calculated only to 2006. Then click on the “NEW! Updated Mean Sea Level Trends” link below the graph legend, and see the trends to 2011, generally reducing from 2006. Why don’t they just update the main graphs? Why hide the later trends below what most people with wide-fomat screens will see, and may assume is the trend to date? Is NOAA trying to hide the inconvenient truth?