Gavin and Jim want you to believe that Scenario B is the right one, because Scenario B’s predictions didn’t suck quite as bad as Scenario A. But it is worse than it seems.
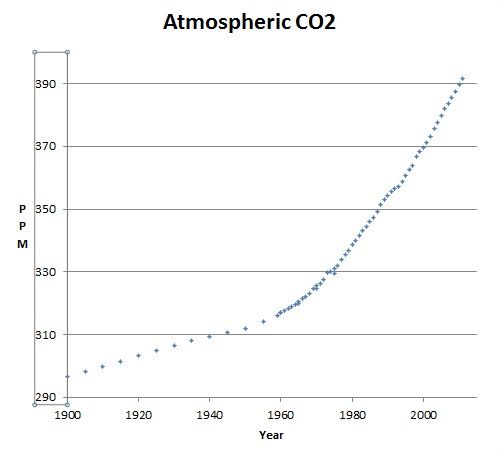
The CO2 curve is an exponential curve. Joe Romm described it as being “super-exponential” The curvature is upwards, which means that the second derivative is positive.
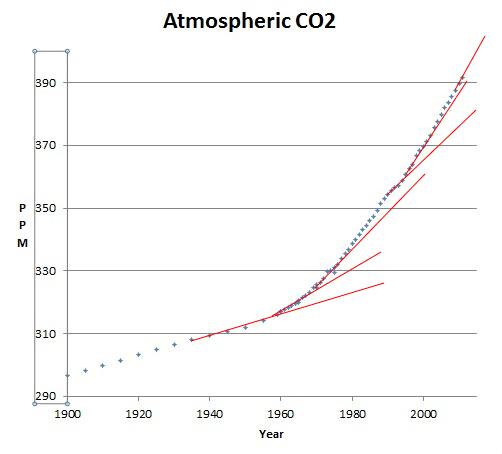
The graph below adds tangents, showing how the slope is getting progressively steeper.
Jim and Gavin naturally assume that their audience is gullible, and have been pushing the Scenario B meme. So let’s look at what Hansen actually wrote in his 1988 paper.

pubs.giss.nasa.gov/docs/1988/1988_Hansen_etal.pdf
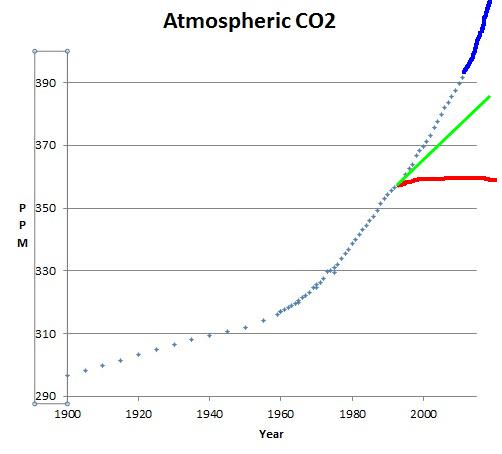
Scenario A assumes exponential growth of CO2. Scenario B assumes linear growth, which clearly is not the case. Scenario C assumes no growth.
The graph below shows what Hansen’s three scenarios would have looked like. Scenario A in blue, Scenario B in green, and Scenario C in red.


CO2 is not a trace gas.
http://www.skepticalscience.com/simply-wrong-solheim-hansen-88.html
jak looks like he had a Mac attack. The only two greenhouse gases in the Earth’s atmosphere of any significance are H2O and CO2.
Wrong, wrong, wrongety wrong.
The only greenhouse gas in the Earth’s atmosphere of any significance is H2O.
Even the leftist warmist wikipedia says it is.
http://en.wikipedia.org/wiki/Trace_gas
From SKS:
” However, the main difference between the various Hansen emissions scenarios is not due to CO2, it’s due to other greenhouse gases (GHGs) like chlorofluorocarbons (CFCs) and methane (CH4), whose emissions have actually been below Scenario C (Figure 1). In fact, more than half of the Scenario A radiative forcing comes from non-CO2 GHGs.”
Now they are dancing around, admitting he was wrong just not as wrong as some claim…..only wrong by 40%, not 150%. It must have been wretching to admit being “wrong.” He’s not a climate scientist but plays one on a blog.
Flaming monkey business. 95% of the greenhouse effect on earth comes from water vapor.Methane and CFC’s contributions are tiny. They are either lying or incompetent.
Again, you’re being critical of his emission estimates and CO2 residency calculations, which were obviously wrong. However, as I’ve pointed out before, we have the data that Hansen’s model used, and Scenario B expected 390ppm atmospheric CO2, and in 2011 that’s the annual average we got. So Scenario B it is.
So again I think you’re missing the big picture. We should focus on Hansen’s claim that there is a certain relationship between CO2 and temperature. That’s where the buck stops and that’s the main game in town. If you focus on some lesser mistake Hansen made, it actually makes it look like you’re unable to address his main argument head on. Let us concede these points to the Warmists, and *then* point out that their claims still fall flat.
Hansen has contradicted himself dozens of times since 1988. I am talking about his original explanations from the original paper.
Will – you’re saying Hansen was wrong on predicting the present level of CO2, of temperatures and of their relationship. What else does he need to be wrong on for his argument to be dismissed?
“super-exponential” means that the curve rises so quickly that it bends over backwards and goes back in time.